Figure 6.

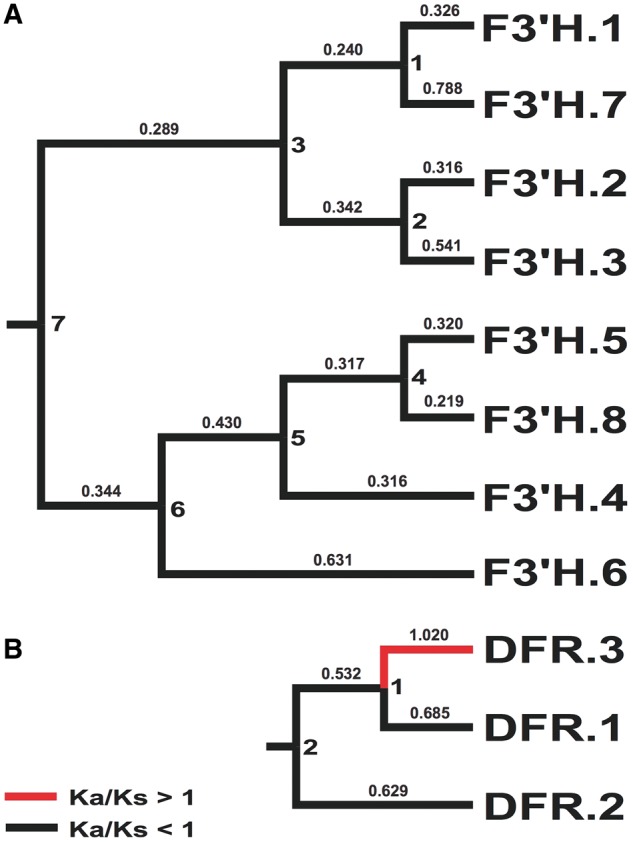
Phylogenetic hypothesis for F3'H (A) and DFR (B) identified in R speciosa. Ka/Ks values shown above branches (values >1 in red). Node IDs (1 through 7 for each gene) reflect Ka and Ks values in Supplementary Tables 3 & 4.

Phylogenetic hypothesis for F3'H (A) and DFR (B) identified in R speciosa. Ka/Ks values shown above branches (values >1 in red). Node IDs (1 through 7 for each gene) reflect Ka and Ks values in Supplementary Tables 3 & 4.