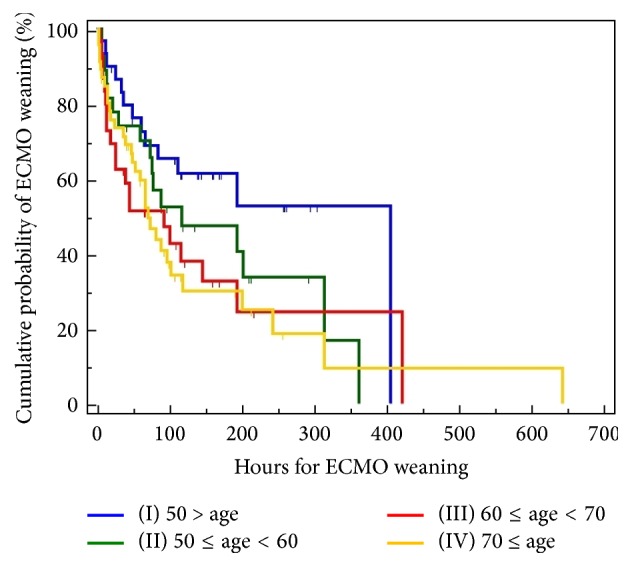
Figure 2.

Kaplan-Meier curves for the cumulative ECMO weaning probability of a pre-ECMO age. To predict in-hospital mortality according to age, patients were divided into 4 groups: group I (age < 50, n = 31), group II (50 ≤ age < 60, n = 27), group III (60 ≤ age < 70, n = 31), and group IV (70 ≤ age, n = 46). Comparison of survival curves with the log-rank test: chi-square test x2 = 5.9915, df = 3, P = .1120. Mean, standard error, and 95% confidence intervals for the mean are summarized in Table 2. Comparison of ECMO weaning probabilities at 48, 72, and 192 hours after ECMO initiation with the log-rank test and hazard ratios with 95% confidence intervals is also summarized in Tables 2 and 4. Overall mean ECMO weaning rate was 39.20%, 8-day mean ECMO weaning rate was 50%, 10-day mean ECMO weaning rate was 45.8%, and 30-day mean ECMO weaning rate was 37.4%.
