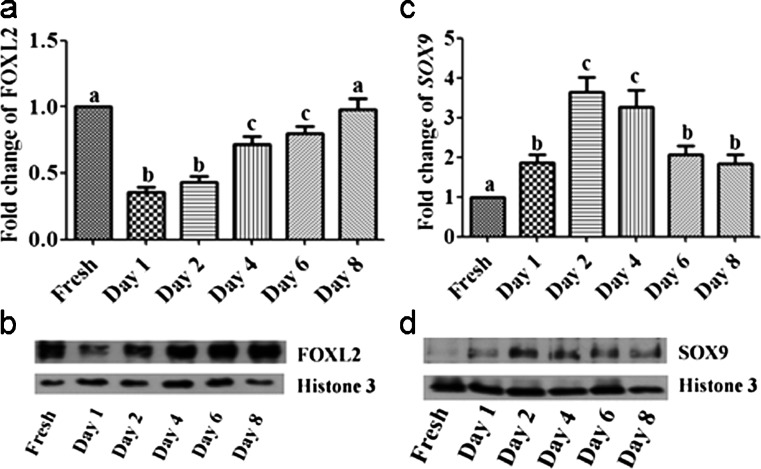
Fig. 2.
Transcript and protein abundance of FOXL2 and SOX9 in freshly isolated and cultured granulosa cells. Transcript and protein abundance of FOXL2 (a, b) and of the Sertoli cell marker SOX9 (c, d) as determined by RT-qPCR (a, c) and immunoblotting (b, d; representative blots). Different letters indicate significant differences of fold changes (mean fold change ± standard error; P < 0.05; one-way ANOVA from three independent experiments) relative to freshly isolated cells

