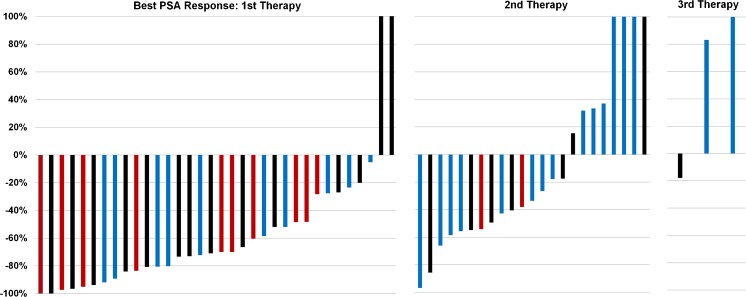
Fig. 2.
Best PSA response after the first, second and third therapies with 131I-MIP-1095. As demonstrated by this figure, the second and third therapies were significantly less effective compared to the first therapy. There was no association between the applied activity and the PSA response (first therapy: p = 0.70; second therapy: p = 0.74). Blue bars: patient group 1 (<3.5 GBq applied activity); black bars: patient group 2 (3.5–5.0 GBq applied activity); red bars: patient group 3 (>5 GBq applied activity)

