Fig. 1.

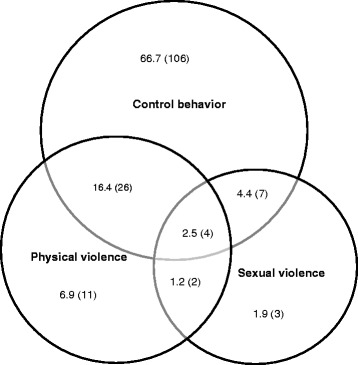
Overlap of exposure to physical and sexual violence and controlling behavior (N = 159). Presented as past year frequency (n) and percentage of women exposed to any type of violence

Overlap of exposure to physical and sexual violence and controlling behavior (N = 159). Presented as past year frequency (n) and percentage of women exposed to any type of violence