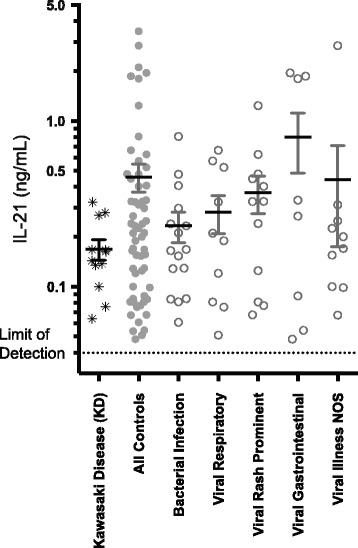
Fig. 1.

IL-21 levels in KD versus febrile controls. Results represent pooled data of IL-21 of duplicated wells from two separate experiments (see Additional file 1: Table S1 for grouping data). Mean and standard deviations are noted by error bars. IL-21 is graphed on a log10 scale to improve display of data points
