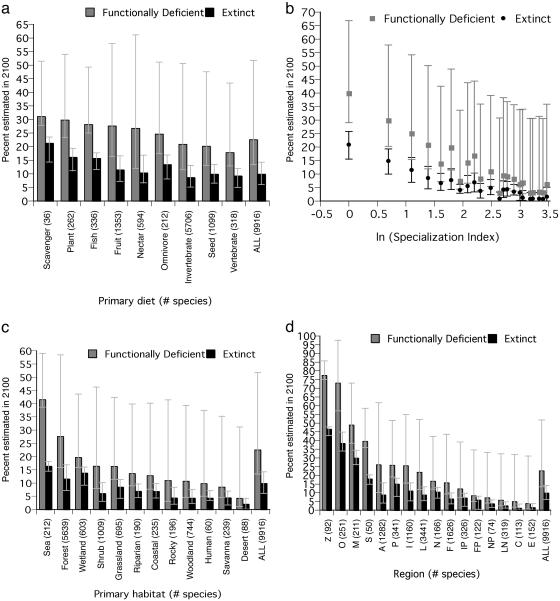
Fig. 2.
Predicted percentages of extinct and functionally deficient bird species for 2100 based on scenario 2 (intermediate). Threatened and extinct species are considered functionally deficient. Error bars, not used in a conventional sense, indicate averages of 10,000 simulations of scenarios 1 (best case) and 3 (worst case). See Fig. 1 for category details. (a) Distribution based on primary diet. (b) Specialized species are more likely to be extinct (r2 = 0.894) and functionally deficient (r2 = 0.879). (c) Distribution based on primary habitat. (d) Distribution among biogeographic regions. Some combination regions were excluded for the sake of clarity.

