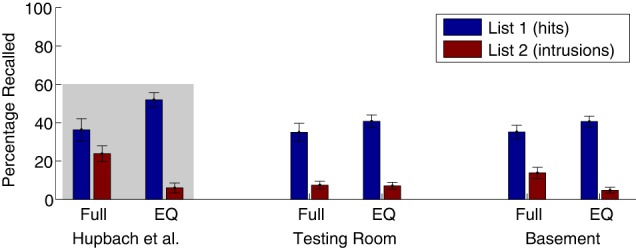
Figure 3.

Percentage recalled from the target list (List 1; hits) and from the interference list (List 2; intrusions) on Day 3, in Experiment 2. To enable direct comparison, the mean values from Hupbach et al. (2007, 2008) are replotted here, within the gray-shaded region (left), and two groups of Experiment 1 are plotted in the middle bars. Error bars plot standard error of the mean across participants. Group labels are as follows: Full Reminder groups (same room, experimenter, and reminder question). EQ Experiment/Question groups (different room, but same experimenter and reminder question). For Experiment 1 (middle bars), rooms A and B were both testing rooms. For Experiment 2 (right bars), room A was the basement room and room B (EQ group only) was a testing room.
