
Figure 4.
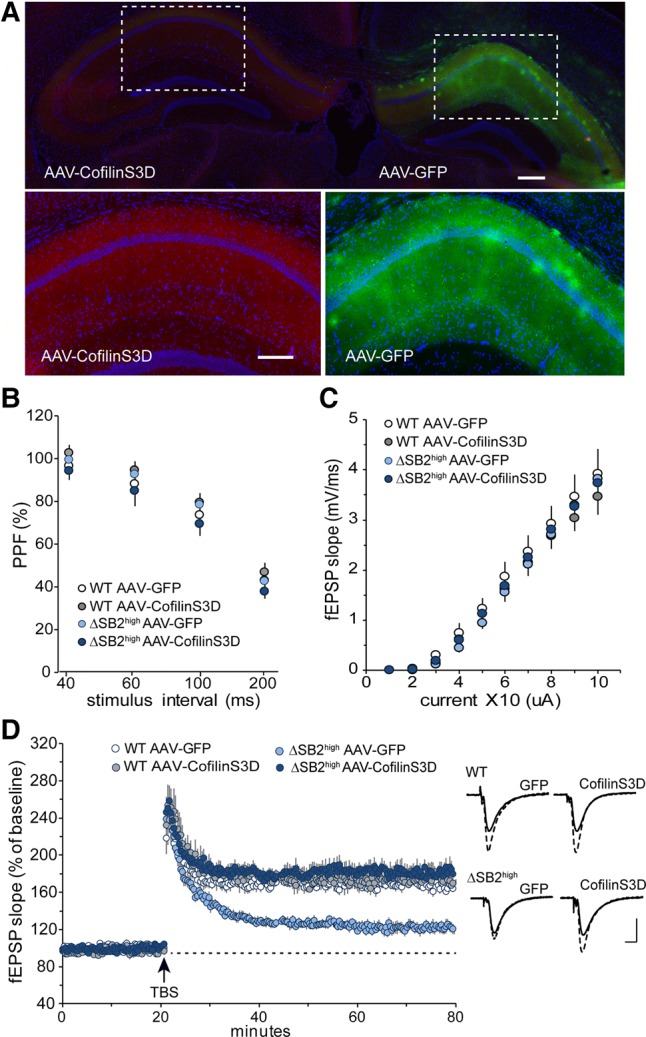
AAV-cofilinS3D expression in dorsal hippocampus rescues LTP deficits in CA1 stratum radiatum. (A) AAV-cofilinS3D and AAV-GFP are expressed throughout dorsal hippocampus (top image bilateral, 4×). Viral expression is localized by HA tag (AAV-cofilinS3D) or GFP expression (AAV-GFP) (lower images 20×). Scale bars 200 µm. (B) Paired-pulse facilitation of the initial slope of the synaptic response in hippocampal CA1 (40, 60, 100, and 200-msec inter-pulse intervals) was not significantly difference between groups (n = 5 mice/group, RM ANOVA: F(3,18) = 1.00, P = 0.417). (C) Input/output curves across a range of stimulation currents in hippocampal CA1 show no measurable different between groups (n = 5 mice/group, F(3,18) = 0.37, P = 0.776). (D). LTP in CA1 stratum radiatum following five theta bursts (TBS; arrow) in slices from wild-type or BAF53bΔSB2high mice expressing either AAV-GFP or AAV-cofilinS3D. Each animal received both viruses, one per hemisphere. LTP gradually decayed toward baseline in slices recorded from BAF53bΔSB2high mice with the control vector (BAF53bΔSB2high AAV-GFP) with respect to wild-type (WT) controls (AAV-GFP or AAV-cofilinS3D) (n = 5 mice per group, RM ANOVA: F(3,18) = 26.28, P < 0.0001). BAF53bΔSB2high AAV-cofilinS3D showed a complete rescue of the LTP deficits relative to WT controls (n = 5 mice per group, Bonferroni corrected t-tests for each minute of last 10 min of LTP: WT AAV-GFP versus WT AAV-cofilinsS3D all P > 0.05; WT AAV-GFP versus BAF53bΔSB2high AAV-GFP all P < 0.01; WT AAV-GFP versus BAF53bΔSB2high AAV-cofilinS3D all P > 0.05). Traces represent field recordings collected during baseline stimulation and 50 min following TBS for each group. Scale bar: 1 mV, 5 msec.