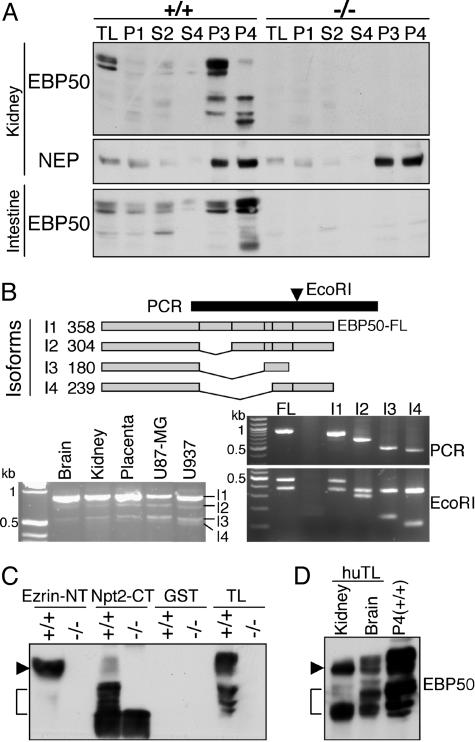
Fig. 3.
The EB region of EBP50 is cleaved in BBM. (A) The Western blot analysis of EBP50 in BBM fractions from EBP50(+/+) and (–/–) mice was carried out on the same samples as in Fig. 2B. Note the presence of EBP50 full-length and low-MW products in membrane fractions from EBP50(+/+) mice. (B)(Upper) EBP50 splice isoforms (I1 to I4) are schematically drawn, and the corresponding size in amino acids is indicated on the left. The black bar indicates the PCR used to identify the isoforms, and the arrowhead marks the position of the EcoRI site used for restriction-fragment-length polymorphism. The PCR on reverse transcribed mRNA extracted from various human tissues and cell lines is shown (Lower Left). The PCR fragments corresponding to the isoforms indicated on the left were subcloned from the U937 PCR product (Middle Right) and analyzed for RFLP with EcoRI (Bottom Right). FL, control full-length EBP50. (C) Pull-down assay with GST ezrin-NT and Npt2-CT fusion proteins (5 μg) of proteins (300 μg) from pooled P3 and P4 EBP50(+/+) or (–/–) kidney BBM fractions. Thirty micrograms of proteins from P3 and P4 fractions are included (TL). Note the specific precipitation of EBP50 FL (arrowhead) by ezrin-NT and of low-MW products (bracket) by Npt2-CT. (D) Western analysis showing EBP50 FL (arrow) and low-MW products (bracket) in human tissue lysates (huTL) in comparison with mouse P4 kidney fraction.

