
Fig. 1.
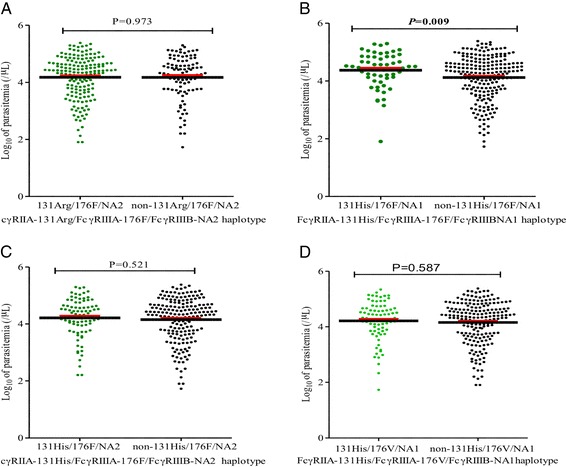
Data are presented as scatter plots for carriage and non-carriage of respective haplotype constructs. The thick black lines through the scatters represent mean, while the red lines above the mean line represent the standard error of the mean (SEM). The carriage of FcγRIIA-131His/FcγRIIIA-176F/FcγRIIIBNA1 haplotype which was marginally associated with susceptibility to SMA had higher levels of parasitemia (P = 0.009). Differences in parasitemia levels were determined using unpaired Student’s t-test with Welsch correction at 95% confidence interval