Fig. 2.

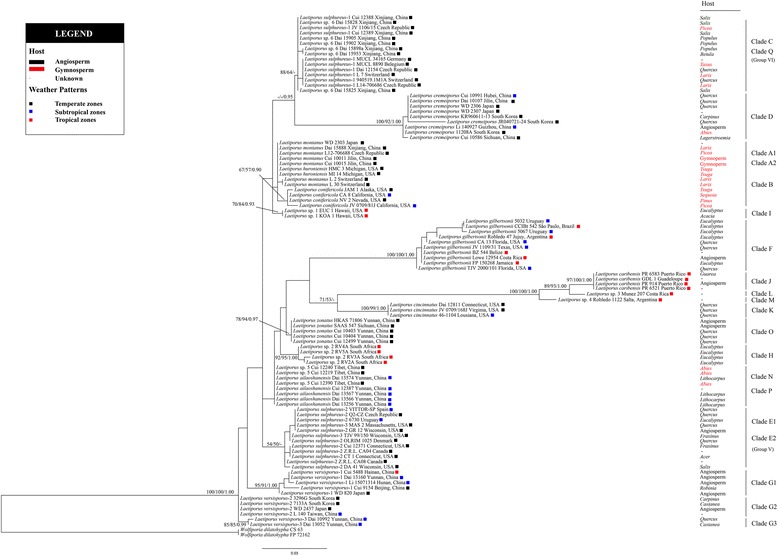
Phylogenetic tree inferred from the maximum likelihood (ML) analysis based on the ITS sequences. Branches are labeled with MP/BS values if greater than 50% and with BPP values if greater than 0.90

Phylogenetic tree inferred from the maximum likelihood (ML) analysis based on the ITS sequences. Branches are labeled with MP/BS values if greater than 50% and with BPP values if greater than 0.90