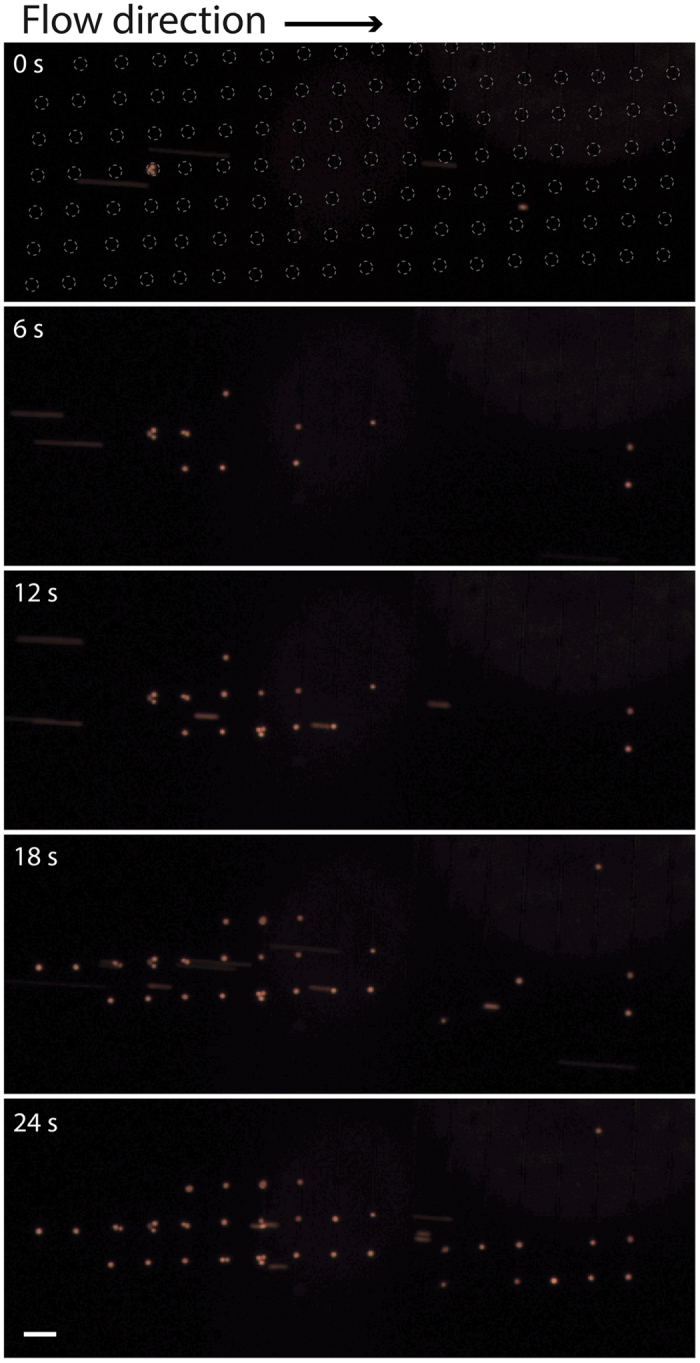
Figure 5. Time lapse sequence showing the trapping of cancer cells (orange) after sorting (extracted from supplementary video S3).

The dashed rings at time 0 s indicated the location of the individual single-cell wells. Scale bar indicates 100 μm.

The dashed rings at time 0 s indicated the location of the individual single-cell wells. Scale bar indicates 100 μm.