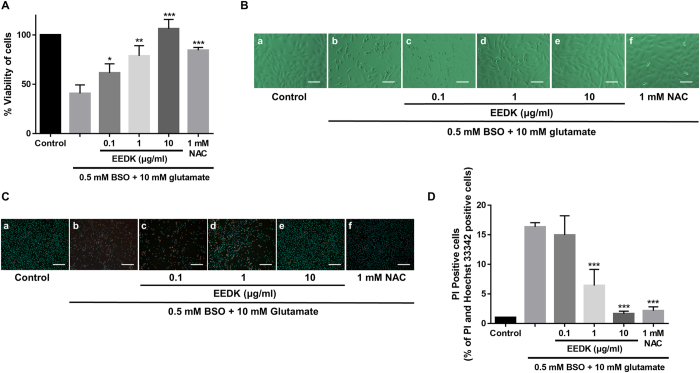
Figure 1. Effect of EEDK on RGC-5 cell death caused by glutamate/BSO-induced toxicity.
(A) Effect of EEDK on the viability of RGC-5 cells exposed to 10 mM glutamate plus 0.5 mM BSO for 24 h, as measured in MTT assays. N-acetyl-l-cysteine (NAC; 1 mM) was used as a positive control. (B) Representative cell-morphology images obtained by light-contrast microscopy: (a) control cells (treated with 0.5% DMSO), (b) cells treated with 10 mM glutamate plus 0.5 mM BSO, (c–e) cells treated with EEDK (0.1 to 10 μg/ml), glutamate, and BSO, and (f) cells treated with 1 mM NAC with glutamate plus BSO. Scale bar = 50 μm. (C) Representative fluorescence images of PI (red) and Hoechst 33342 (blue) staining: (a) control cells (0.5% DMSO), (b) cells treated with 10 mM glutamate plus 0.5 mM BSO, (c–e) cells treated with EEDK (0.1 to 10 μg/ml), glutamate, and BSO, and (f) cells treated with 1 mM NAC with glutamate and BSO. Scale bar = 50 μm. Bar graphs represent the quantitative analysis of PI-positive cells. The results shown are the mean values with error bars indicating the S.E.M. (*p < 0.05, **p < 0.01, and ***p < 0.001). Experiments were repeated 3 times, independently.

