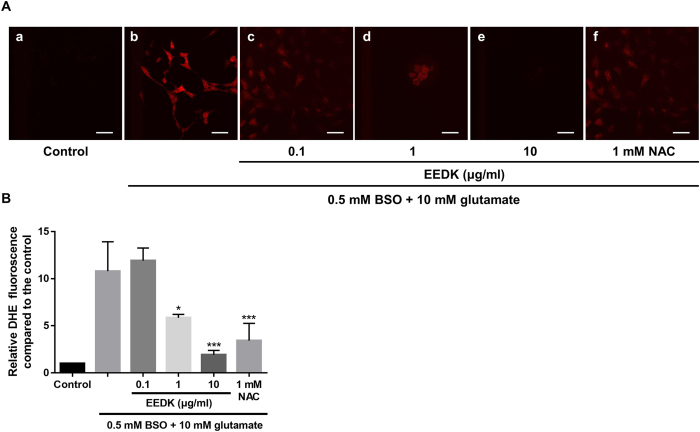
Figure 2. Effect of EEDK on ROS levels in response to glutamate/BSO.
(A) Representative confocal microscopy-based fluorescence images following DHE staining (original magnification, 400×): (a) control cells (treated with 0.5% DMSO), (b) cells treated with 10 mM glutamate and 0.5 mM BSO, (c–e) cells treated with EEDK (0.1 to 10 μg/ml), glutamate, and BSO, and (f) cells treated with 1 mM NAC, with glutamate and BSO. (B) Quantification of DHE fluorescence was performed by analysis of 4 representative fields from each of 4 wells. Scale bar = 50 μm. The results shown are the mean values with error bars indicating the S.E.M. (*p < 0.05, ***p < 0.001). Experiments were repeated 3 times, independently.

