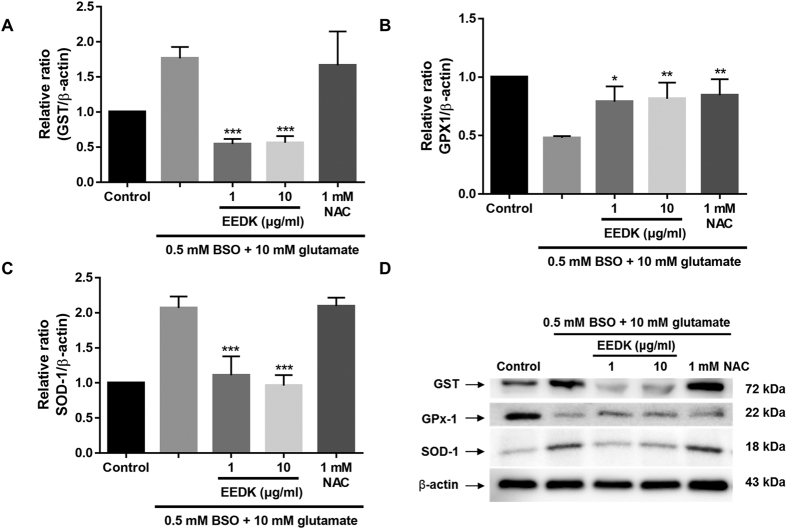
Figure 3. Effect of EEDK on antioxidant-associated proteins.
(A–C) Bar graphs showing quantitative analysis of the corresponding proteins. (D) Western blot analysis of the effects of EEDK pre-treatment on expression of the antioxidant-associated proteins GST, GPx-1, and SOD-1. Protein levels are expressed as the mean ± S.E.M. from 3 independent experiments (*p < 0.05, **p < 0.01, and ***p < 0.001).

