Figure 5.
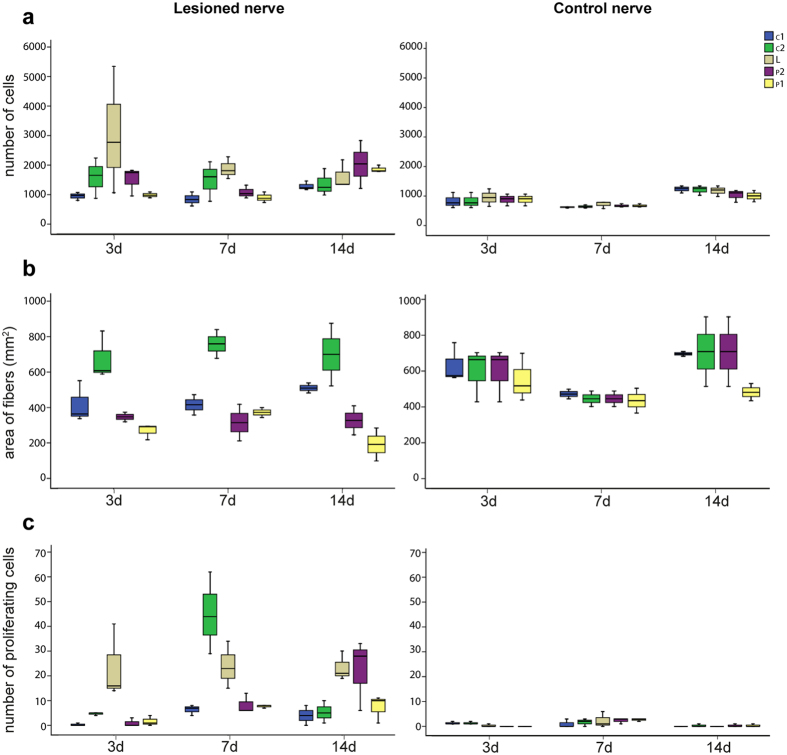
Boxplots showing (a) number of cells involved in scar formation, (b) nerve fibers degeneration/regeneration and (c) cell proliferation after octopus pallial nerve transection. Three days post lesion (3d), an increase in the number of cells (a) is observed in LL, consisting of scar formation and hemocytes infiltration (LL vs CL, p = 0.043 after Student’s t-test). The same area is also interested by intense mitotic activity. (b) LC2 area shows a high increase in nerve fiber area due to axon regeneration at all time-points investigated (at 7d, LC2 vs CC2 p < 0.010 after Student’s t-test), while degeneration is mainly observed in LP2 (at 3d, 7d and 14 days, LP2 vs CP2 p < 0.010 after Student’s t-test) and LP1 14d. (c) Cell infiltration and proliferation inside the cut nerve is also observed in LC2 seven (7d, LC2 vs CC2 p = 0.001 after Student’s t-test) and LP2 14 days p.l. (14d, LP2 vs CP2 p = 0.001 after Student’s t-test). Different areas of interest of the pallial nerve analyzed in this study are indicated (see legend in a); see also legend of Fig. 1. See also text for detail and statistics.

