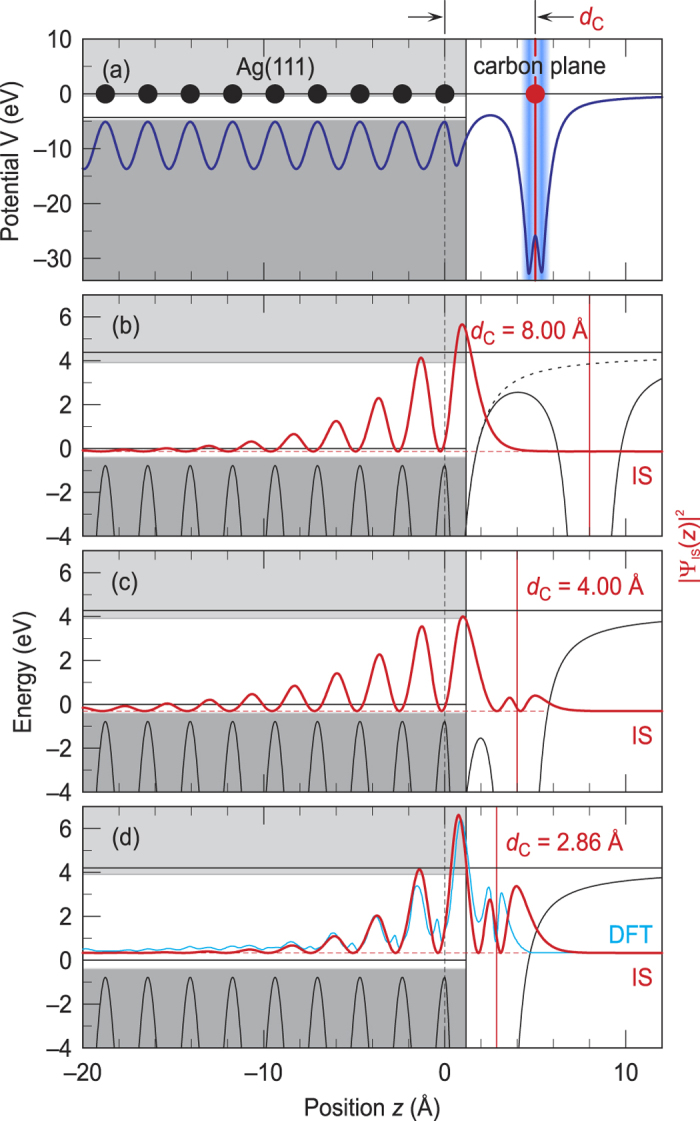
Figure 2.

(a) One-dimensional model potential V(z)(blue solid line) for a carbon layer on Ag(111) at an exemplary metal-C distance of dC = 5.0 Å. The positions of the uppermost Ag atomic layer and the carbon layer are depicted by vertical black dashed and red solid lines, respectively. Black and red circles illustrate the Ag and C atoms, respectively. The Ag(111) projected bulk band structure(gray shaded areas) has been extended up to the metal surface at z0 = a/2. The blue gradient illustrates the extension of the conjugated π-system of graphene35.(b–d) show the probability densities |ΨIS(z)|2(solid red curve) of the interface state at the graphene/Ag(111) interface for metal-C distances dC of 8.00 Å(b), 4.00 Å(c) and 2.86 Å(d).(b) additionally shows the image-potential of the bare metal surface(dotted black line). A comparison with the results of the DFT calculations for PTCDA/Ag(111)(cyan, data extracted from Fig. 4 of ref. 23) is given in(d).
