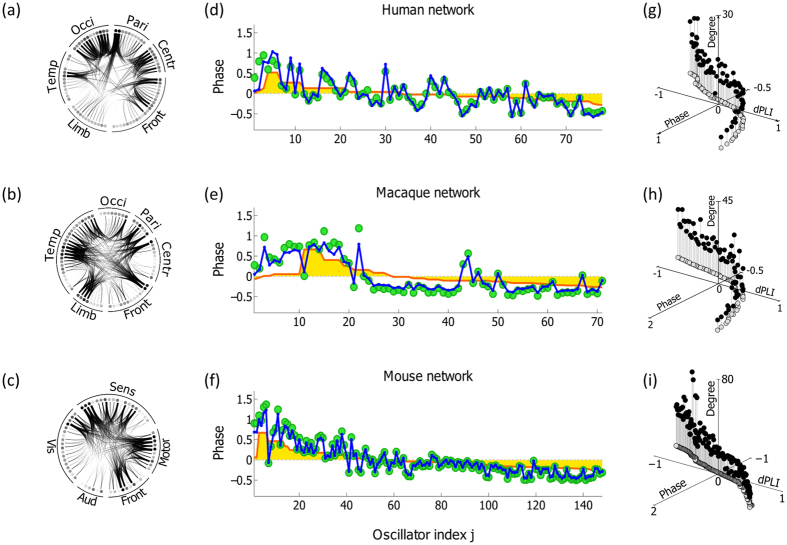
Figure 3. Comparison between the analytical and simulation results for brain networks of three species.
The brain network structures of(a) human,(b) macaque, and(c) mouse are depicted using ring plots. The brain networks are separated into several groups: frontal(front), central(centr), parietal(pari), occipital(occi), temporal(temp), limbic(limb), motor(motor), somatosensory(sens), visual(vis), and auditory(aud). The dots and lines in the ring plot denote the nodes and connections in a network. Only the top 30% of node degrees are presented. Figure 3(d),(e) and(f) present the analytical results of mean-field approximation method(red line,  ) and local order parameter method(blue line,
  ), and the simulation result(green circle,
  ) for human, macaque, and mouse. The nodes are arranged in the ascending order of node degree(from periphery to hub) on the x-axis and the relative phases on the y-axis. Figure 3(g),(h) and(i) depict the 3d plots of degree nj, phase ϕj, and dPLIj for human, macaque, and mouse.

