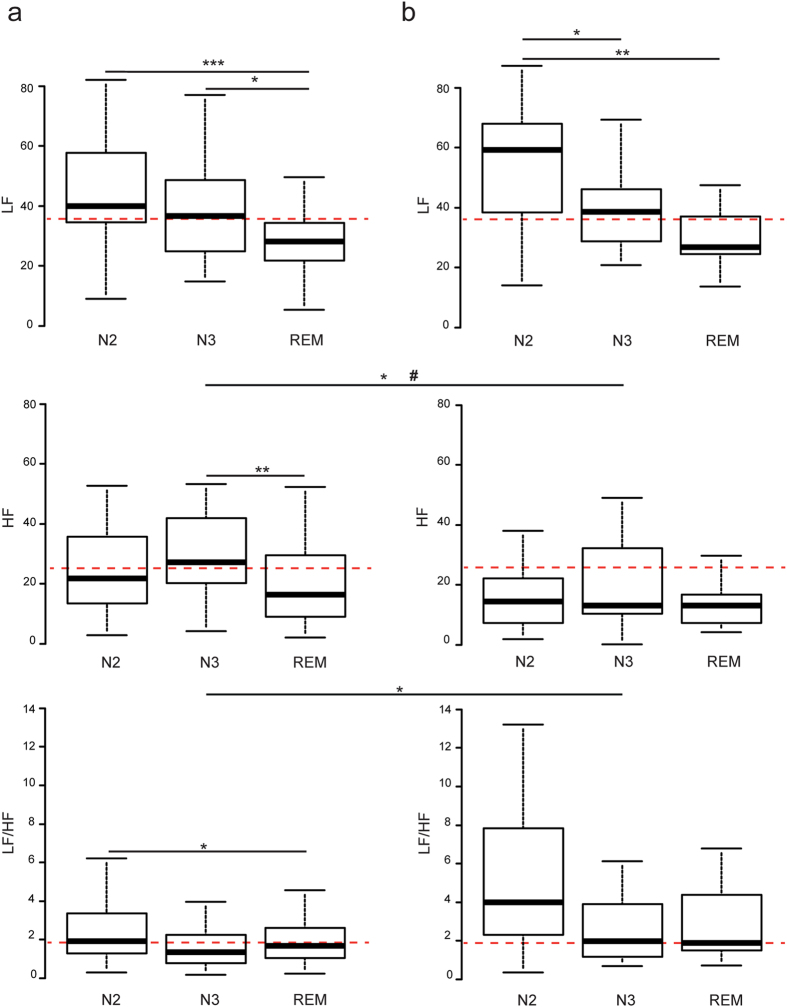
Figure 2. HRV analysis in the frequency domain in RLS patient as a function of the MEIS1 locus.
Box-whisker plots showing LF, HF and LF/HF in RLS TT (a) and RLS GG (b) patients during N2, N3 and REM sleep stages. Red dashed lines indicate the median values for LF, HF and LF/HF in control patients during N2 (a and b). Data are represented as lower quartile, median and upper quartile (boxes), and minimum and maximum ranges (whiskers). *p ≤ 0.05; **p ≤ 0.01; ***p ≤ 0.005 following Student’s or Wilcoxon’s tests. #pa ≤ 0.05 following statistical test adjusted for PLMS.

