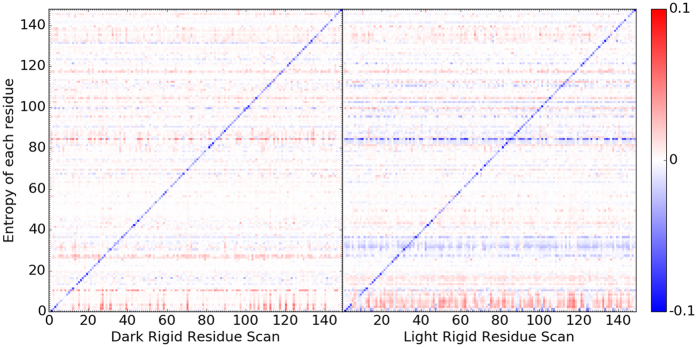
Figure 11. Heat map of individual residue entropy contribution under rigid residue perturbation for Dark(left) and Light(right) states.
The horizontal axis corresponds to the RRS simulations and indices of residues being held as rigid body. The vertical axis corresponds to the residue index for entropy contributions. The entropy contribution from each residue in unperturbed simulation is set as reference.

