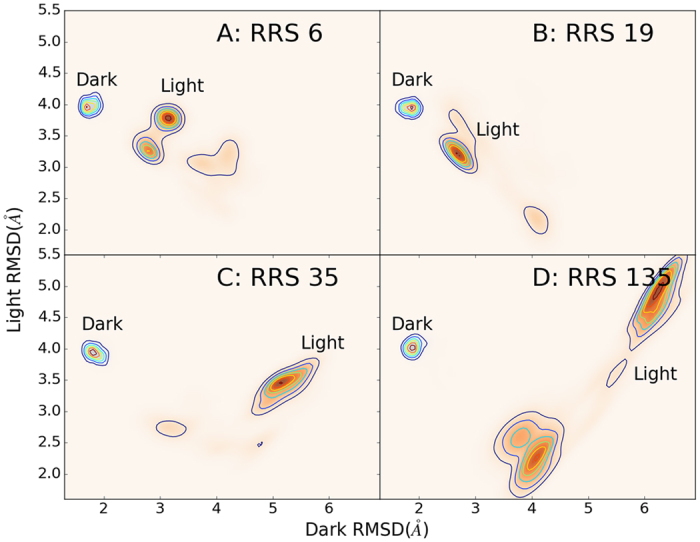
Figure 17. 2D contour plots of Dark and Light states distributions for RRS 6(Pro), RRS 19(Met), RRS 35(Cys), and RRS 135(Glu) MD simulations of Dark and Light states.

RMSD values for X and Y axes are calculated with reference to the optimized Dark and Light structures, respectively.
