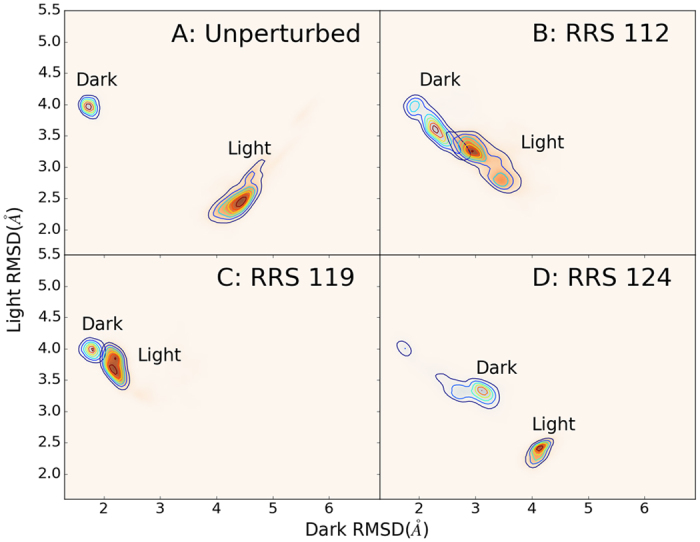
Figure 3. 2D contour plots of Dark and Light states distributions.

(A) Unperturbed simulations(30 ns to be consistent with RRS simulations);(B) RRS 112;(C) RRS 119;(D) RRS 124. RMSD values for X and Y axes are calculated with reference to the optimized Dark and Light structures, respectively.
