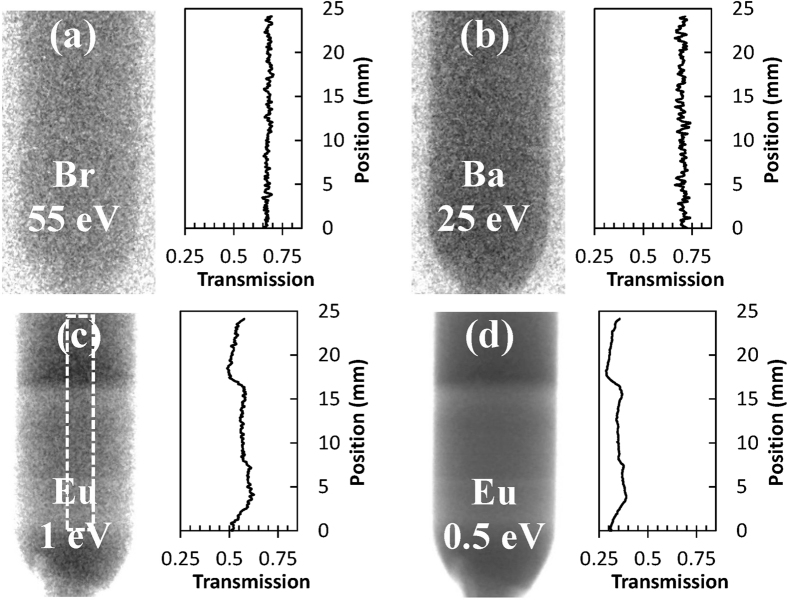
Figure 3. Element-specific neutron transmission images.
Each image was acquired at resonance energy characteristic to Ba, Br, and Eu, respectively. All images are acquired in one measurement at the end of the growth procedure (corresponding to 16th hour in Fig. 2a; the top part of the sample is still in the liquid phase). Cross sections through the images are taken over the same area indicated by the dashed rectangle in Fig. 3c. Note that the cross sections start at the sample location where crystal growth started in our experiment (~5 mm from the bottom of the original charge). Resonance energies of the elements are shown in the legend of each image. No measurable variation of Ba or Br concentration was observed across the sample, while Eu exhibited distinct reduction of its concentration in the solid phase. The variations in Eu concentration in the solid part are due to changes in interface velocity.

