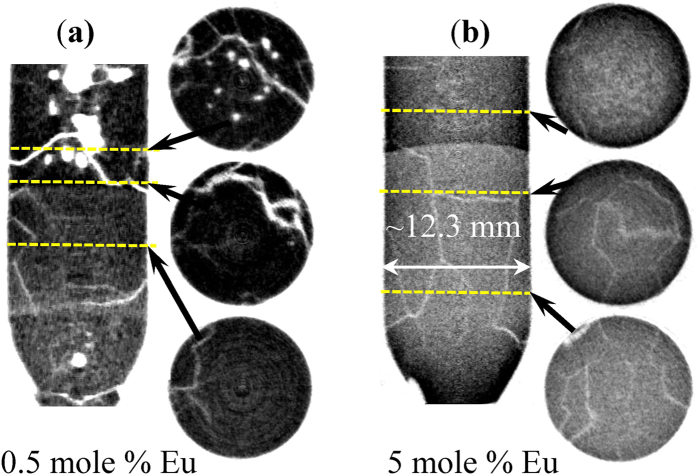
Figure 6. Tomographic reconstruction of BaBrCl:Eu ingots.
(a) 0.5 mole % of Eu; (b) 5 mole % of Eu. Measurement was performed after the crystal growth by slow solidification was stopped and samples were rapidly cooled over a few hours to room temperature. The darker areas correspond to a large Eu concentration. Multiple cracks are seen within the samples, as well as clusters of Eu-deficient areas (in the 0.5% Eu sample) which were formed by rapid solidification propagating from the top of the sample. The images are integrated over the full neutron spectrum of FP5 beamline. The dashed lines indicate the location of horizontal cross sections shown to the right from the vertical cross section through the middle of the samples.

