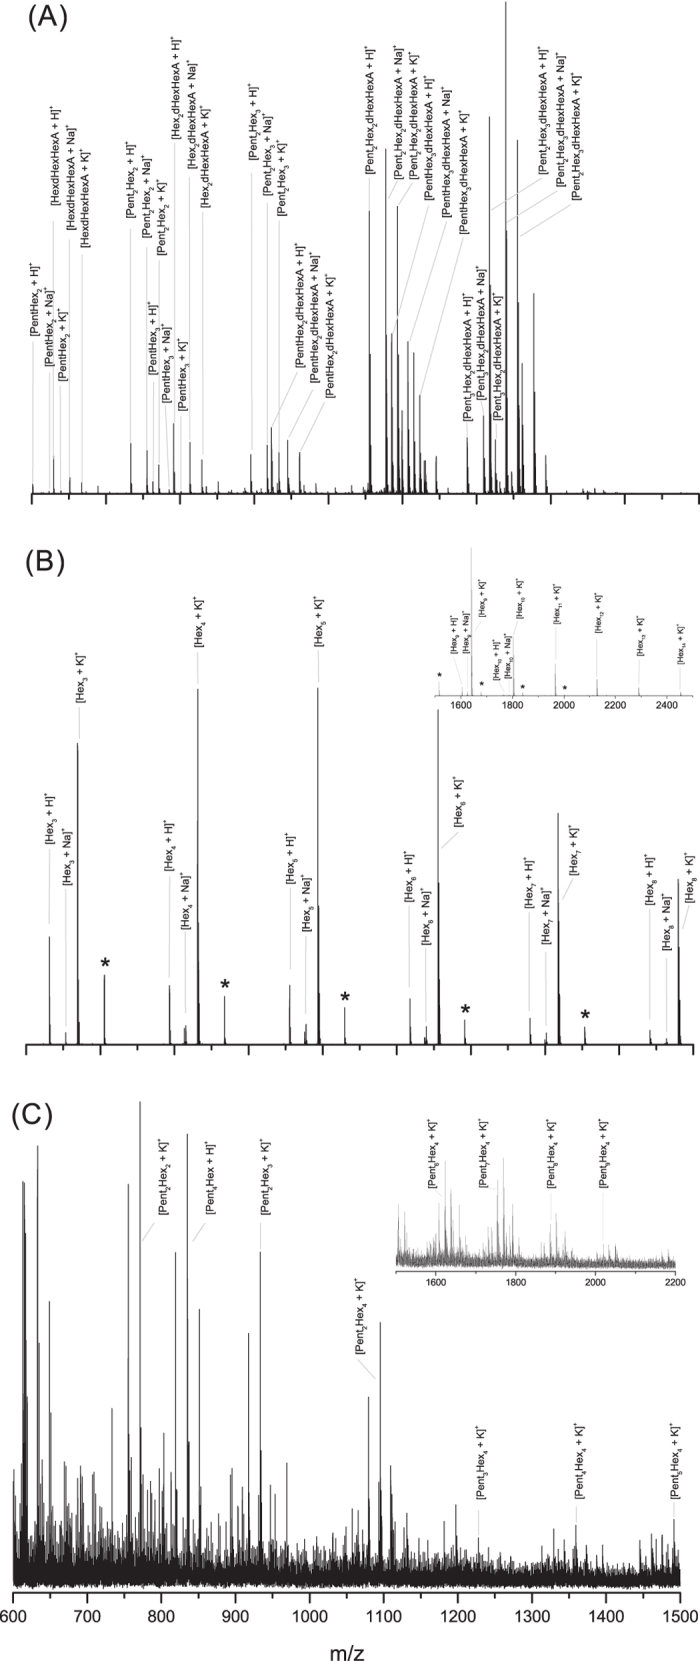
Figure 1.

MS profiles of the enzymatically digested (A) gum arabic; (B) locust bean gum, the m/z range 1500–2500 Da is showed in the magnified region; and (C) cherry gum, the m/z range 1500–2200 Da is showed in the magnified region. The reported ions correspond to oligosaccharides derivatized with 3-aminoquinoline, the non-derivatized ones are indicated with an asterisk (*). The monosaccharide order for each oligosaccharide is arbitrary and does not refer to its structure. The y axis of spectra is the relative intensity.
