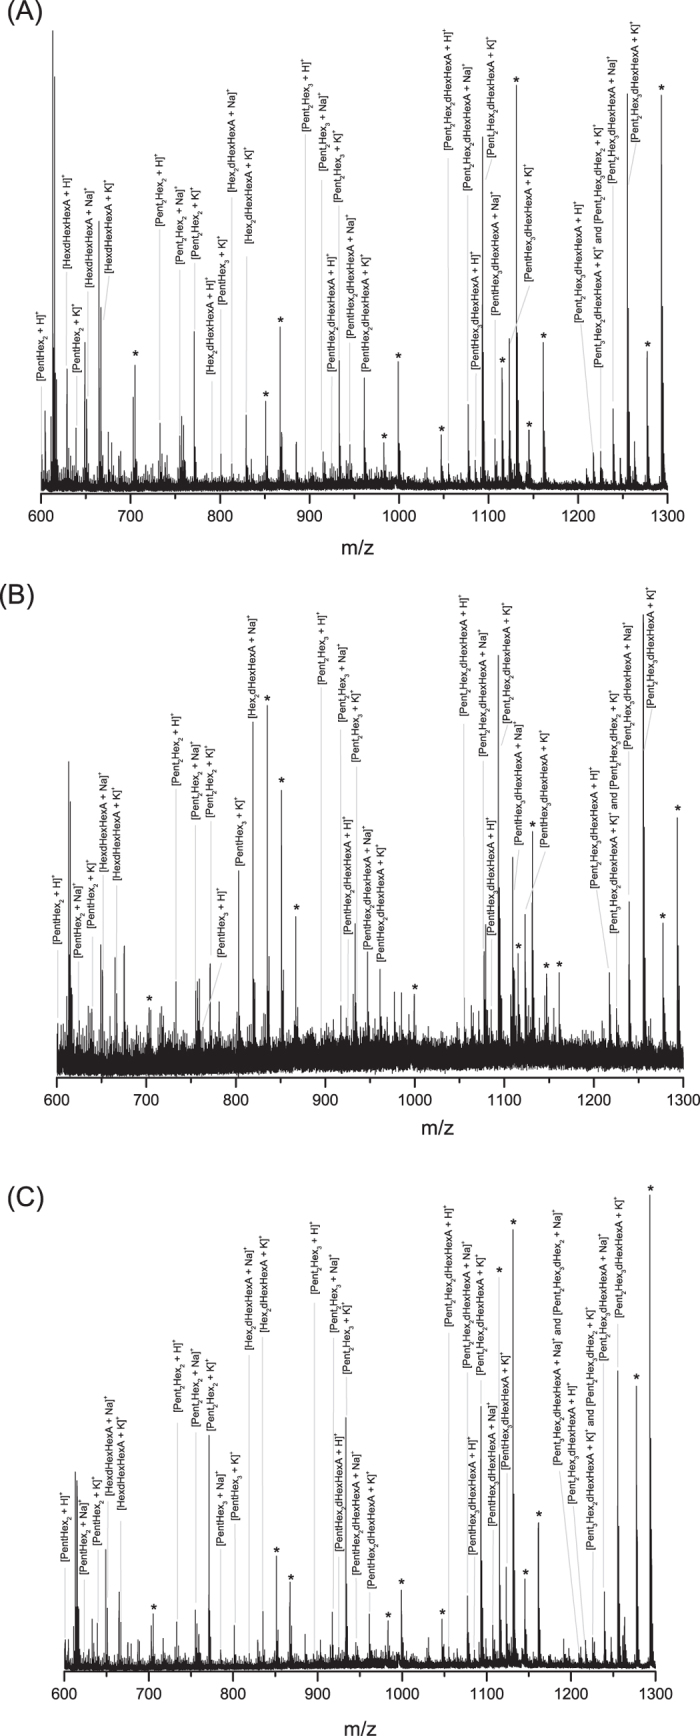
Figure 4.

MALDI-TOF MS spectra of (A) the green and opaque sample (noted Dove 1) from Boat houses (Arthur Dove 1935, The Met #2005.484.3); (B) the grey sample (noted Dove 2) and (C) the light blue sample (noted Dove 3) from Study for ‘Goat’ (Arthur Dove 1934, The Met #49.70.75). *Not identified peaks or underivatized ions for m/z 983.306 (PentHex5 [M + Na]+ a), m/z 999.281 (PentHex5 [M + K]+b), m/z 1115.348 (Pent2Hex5 [M + Na]+c), m/z 1131.322 (Pent2Hex5 [M + K]+d), m/z 1277.401 (Pent2Hex6 [M + Na]+e) and m/z 1293.375 (Pent2Hex6 [M + K]+f). Derivatized forms of oligosaccharidesa,b,c,d,e,f are identified in the spectra: a at m/z 1109.364, b at m/z 1125.338, c at m/z 1241.406, d at m/z 1257.381, e at m/z 1403.459 (not shown), f at m/z 1419.459 (not shown).
