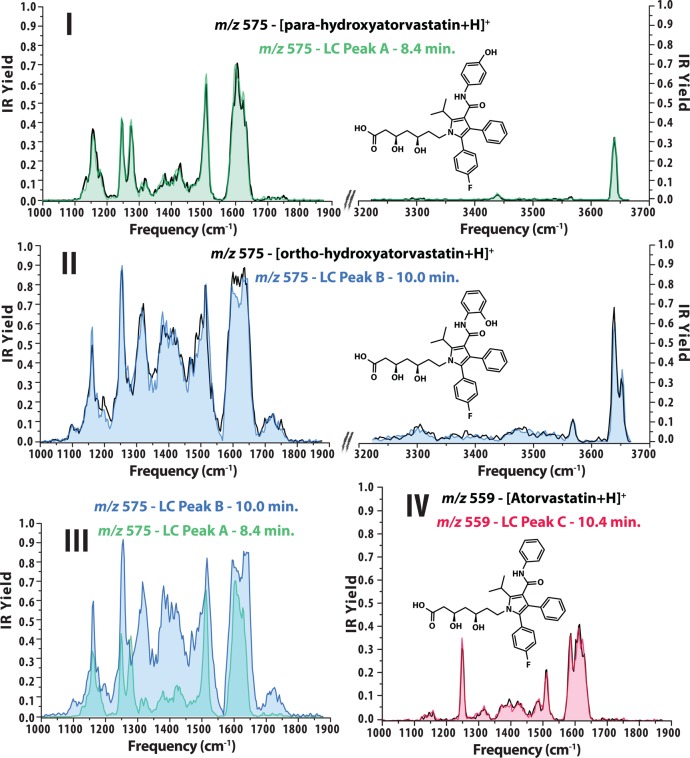
Figure 2.
Panels I and II present IR spectra (colored traces) generated for ions at m/z 575 from LC fractions A and B and the identification of isobaric drug metabolites based on IR spectral match with reference compounds (black traces). Panel III highlights the difference in IR spectra of the two isomeric metabolites. Panel IV contains the IR spectrum measured for unmetabolized atorvastatin (peak C in LC chromatogram presented in Figure 1).

