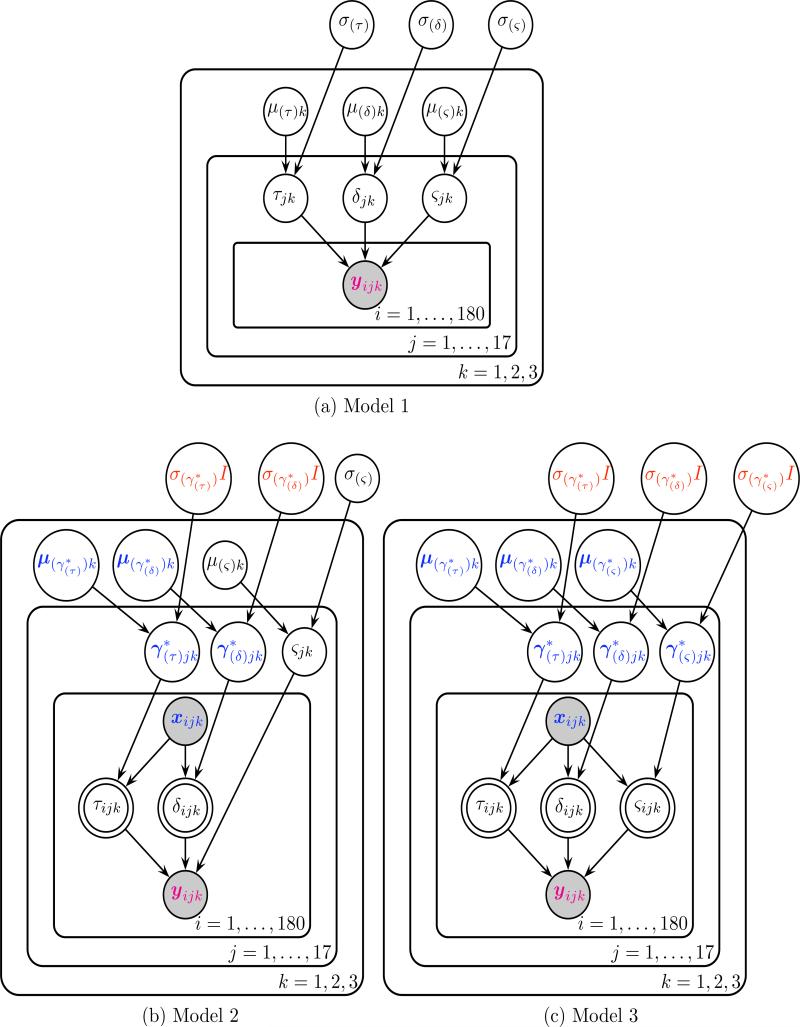
Figure 4.
Graphical representations of the three hierarchical Bayesian models following the convention of Lee and Wagenmakers (2014). Each node represents a variable in the model with arrows indicating what variables are influenced by other variables. The magenta 2 ∗ 1 vector of reaction time and accuracy yijk and the blue (p + 1) ∗ 1 vector of p EEG regressors (+1 intercept) xijk are observed variables, as indicated by the shaded nodes. Bolded blue variables indicate (p + 1) ∗ 1 vectors, such as the subject j level effects of each EEG regressor and the condition k level effects μ(γ∗)k of each EEG regressor. In Model 3 for each trial i, values of non-decision time τijk, drift rate (evidence accumulation rate) δijk, the diffusion coefficient (evidence accumulation variance) ςijk are deterministic linear combinations of single-trial EEG regressors xijk and the effects of those regressors that vary by subject and condition.

