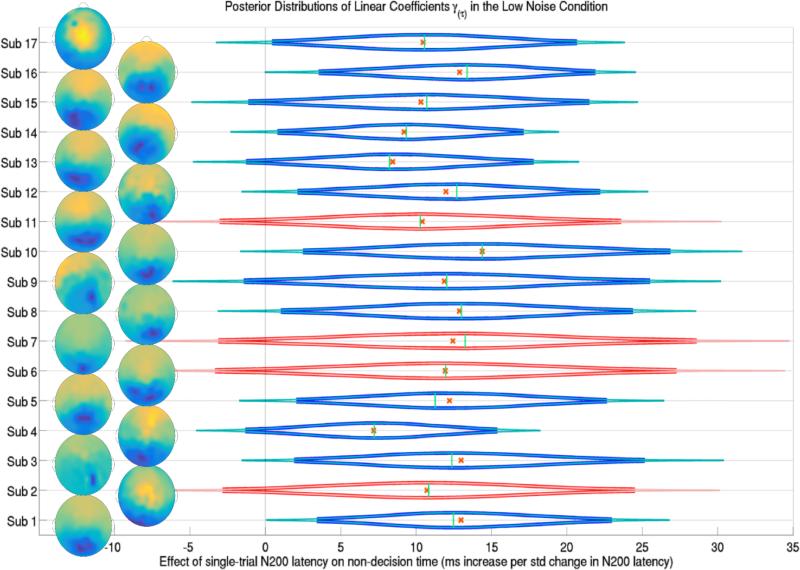
Figure 6.
The posterior distributions of the effect of a trial's N200 latency during the response interval (onset attention latency to the signal stimulus) on trial-specific non-decision times τijk for each subject j in the low noise condition k = 1. Subjects 2, 6, 7 and 11 were left out of the training set and their predicted posterior distributions are shown in red. Thick lines forming the distribution functions represent 95% credible intervals while thin lines represent 99% credible intervals. Crosses and vertical lines represent posterior means and modes respectively. Also shown are the topographic representations of the channel weights of the first SVD component of each subject's response interval ERP, indicating the location of single-trial N200s over occipital and parietal electrodes. Evidence suggests that longer attentional latencies to the signal, N200 latencies, are linearly correlated with longer non-decision times in the low noise condition.

