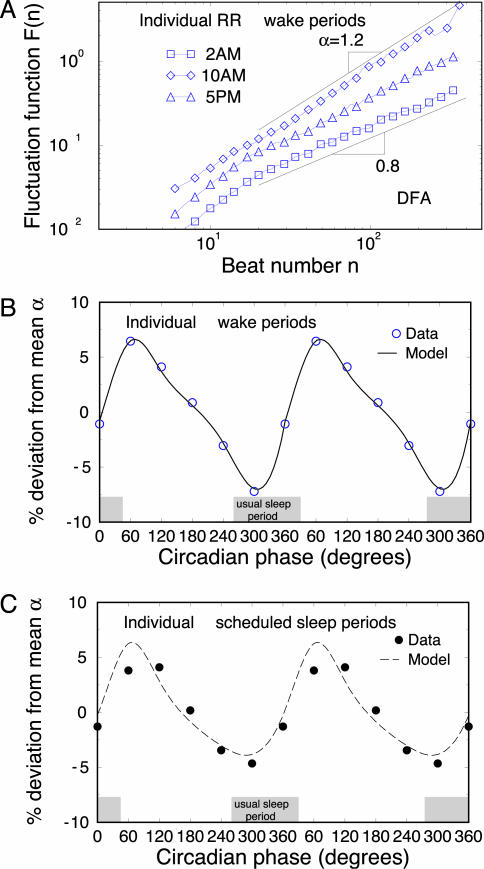
Fig. 2.
Circadian rhythms in the correlation property of heartbeat dynamics. (A) DFA results of 1-h RR intervals for an individual at three different times representing different circadian phases during wake periods. The scaling curves are vertically shifted for clarity. The power-law form of the fluctuation function F(n) ≈ nα with α > 0.5 indicates presence of long-range correlations in the heartbeat signals. The value of α in each 1-h window is obtained by fitting F(n) in the range 20 < n < 400 beats. Significant circadian rhythms are observed in the deviation of the α value for individual data during both wake periods (B) and sleep-opportunity periods (C). The data are shown as symbols, and the cosinor model fits are shown as lines. The results of α in B and C are double-plotted to better visualize rhythmicity. The results are consistent for all five subjects during wake periods and sleep-opportunity periods. The individual's habitual sleep period when living outside the laboratory is indicated (gray shaded boxes).

