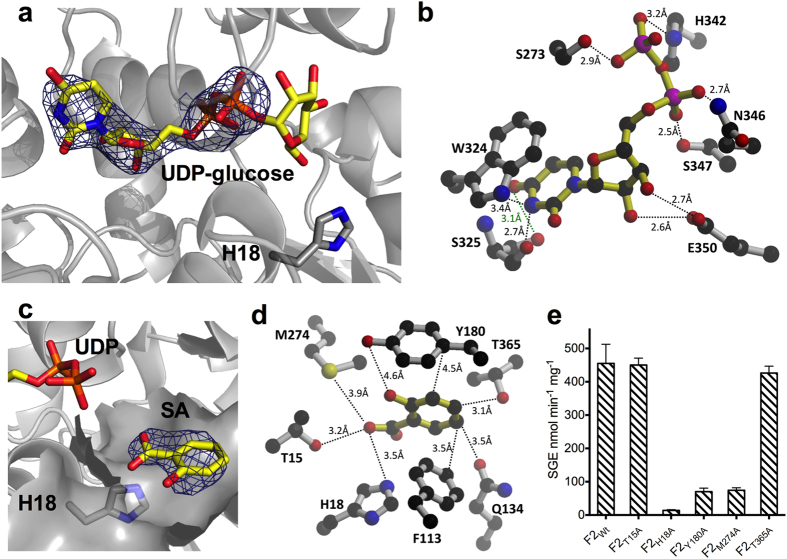
Figure 3. Ligand binding to UGT74F2.
(a) Omit electron density for UDP (1σ, blue mesh) shows clear density for UDP, but not for terminal glucose (UDP-glucose in yellow sticks). (b) Key residues interacting with UDP and potential hydrogen bonds. (c) Omit electron density (1σ, blue mesh) for SA. (d) Residues interacting with SA (for clarity we omitted residues Met 183, Val 184 and Trp 364). (e) SGE production by UGT74F2 mutants of the SA-binding site at 3 min in standard assay conditions. Error bars represent standard deviation from three measurements.

