
Extended Data Figure 10. CA1-LTP requires exogenous BDNF.
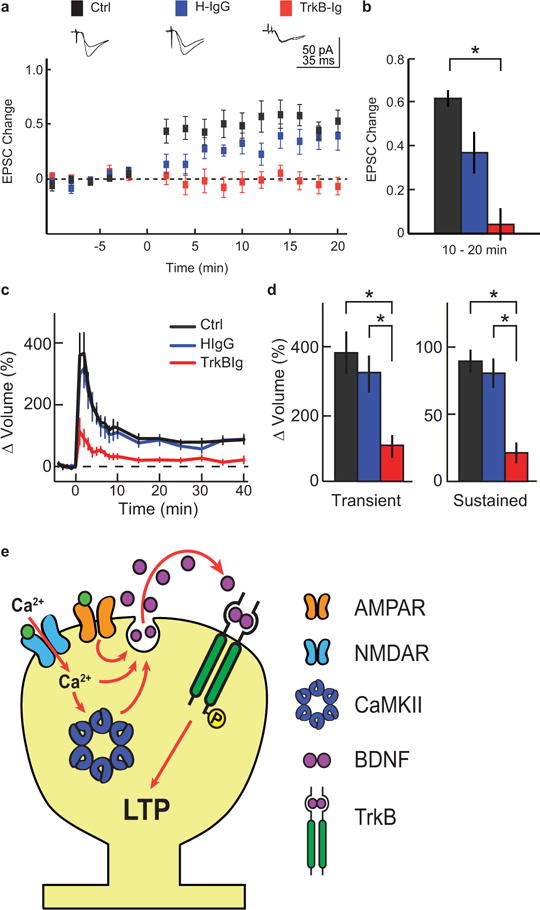
a, Time course of average EPSC amplitude changes recorded in CA1 pyramidal cells evoked by Schaffer collateral stimulation before and after LTP induction in the absence (Ctrl) or presence of human-IgG (H-IgG) or TrkB-Ig. Representative traces are above the graphs. n = 22 Ctrl, 9 H-IgG, and 12 TrkB-Ig (animals).
b, Quantification of EPSC amplitude changes averaged over 10–20 min following LTP induction.
c–d, Time course (c) and quantification (d) of the transient and sustained glutamate-uncaging-induced spine volume change in rat hippocampal slices in the absence (Ctrl) or presence of human-IgG (H-IgG) or TrkB-Ig. n = 8/8 Ctrl, 6/8 TrkBIg, and 4/6 HIgG (cells/spines).
e, Model of spine autonomous, autocrine, BDNF release and post-synaptic TrkB activation.
Data are mean +/− s.e.m. *p < 0.05 as determined by an ANOVA followed by Tukey’s method to correct for multiple comparisons.