
Extended Data Figure 7. Effects of sensor expression levels on changes reported by the sensor.
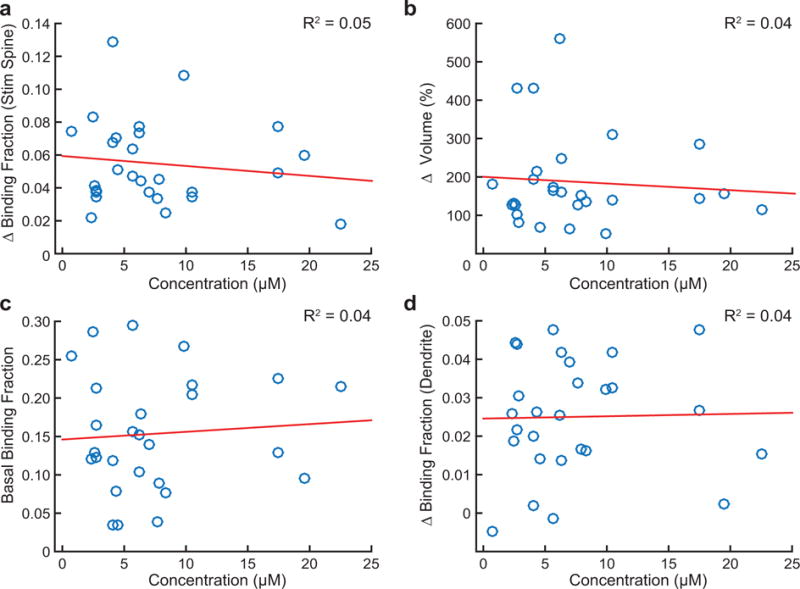
a-d, Effect of TrkB-mEGFP concentration as measured in individual neurons on corresponding change in binding fraction of the stimulated spine (a), change in spine volume (b), binding fraction prior to uncaging (basal binding fraction) (c), and change in binding fraction of the dendrite (d). n = 25/28 (cells/spines).
Data are mean values and were fit to a linear regression model with corresponding coefficients of determination (R2) provided for each.