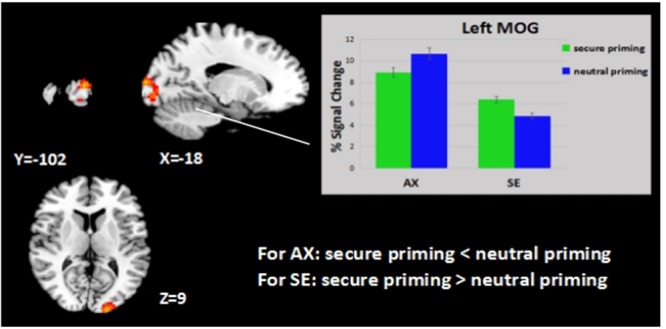
FIGURE 2.

Attachment group × priming effect. Displayed is a rendering of (attachment group × priming) interaction from the factorial analysis. Bar chart displays the percent signal change in highly attachment anxiety and in controls for secure priming (green) and neutral priming (blue) conditions. Detailed results can be found in Table 2B.
