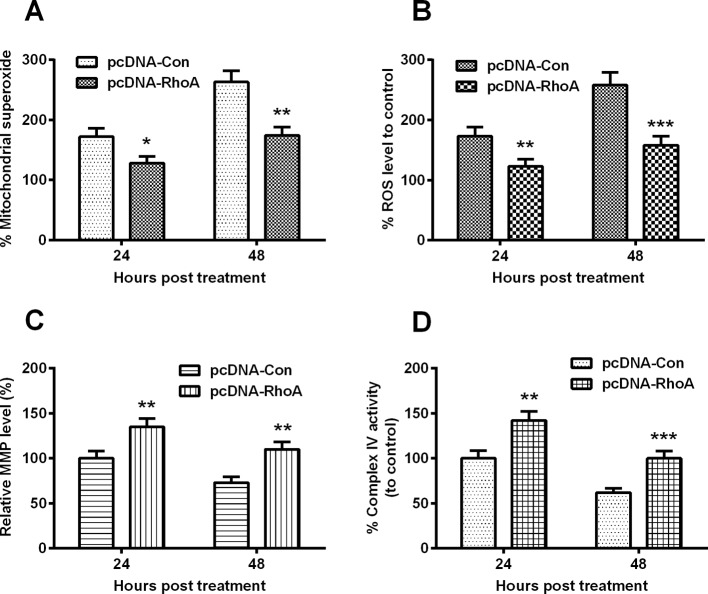
Figure 2. Mitochondrial dysfunction in the hypoxia-treated C28/I2 cells.
C28/I2 cells were inoculated under hypoxia or normoxia for 12, 24 or 48 h and then the percentage of mitochondrial superoxide levels (A), of ROS level (B), of MMP (C) and of Complex IV activity (D) were assayed respectively. All results were averaged for three independent experiments. *P<0.05; **P<0.01; ***P<0.001 or ns: no significance.

