Figure 2.
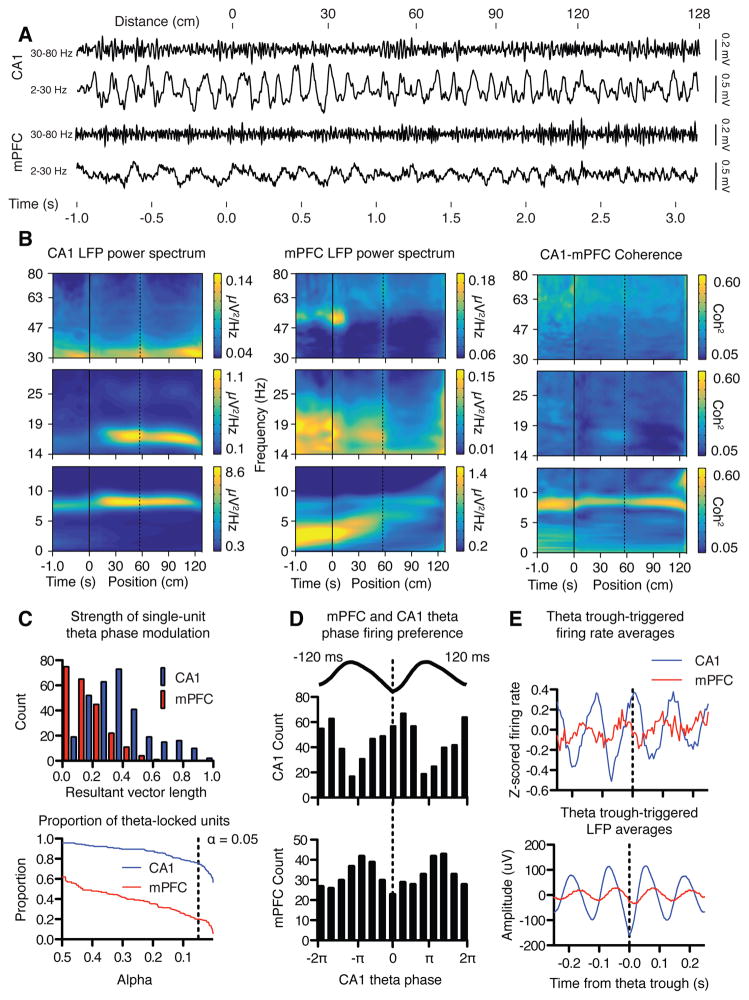
Theta oscillations were coordinated in the mPFC and CA1 as rats perform the spatial reversal task. (A) Typical examples of LFPs recorded in CA1 (top traces) and mPFC (bottom traces) as rats progress through a single trial, each filtered in either low (lower trace) or high (upper trace) frequency bands. CA1 LFPs oscillate persistently in theta while mPFC LFPs revealed a different pattern in which oscillations increased in frequency and decreased in amplitude across the trial. (B) Power spectrograms quantified group averaged LFP data in 0–14, 14–30, and 30–80 Hz bands, and show that CA1 theta power was greatest on the start arm (left). Spectrograms verified the more dynamic mPFC power spectra (middle). Trials began with prominent 4 Hz oscillations that increased in frequency as animals approached the goal arm. Theta oscillations became prominent as animals entered the goal arm, and increased in frequency just before animals reached the reward point. Theta coherence was strongest before a trial was initiated, and after animals crossed into the goal arm (right). Negative values on the horizontal axis indicate time before initiation of the trial, and positive values indicate position on the maze in cm. The dotted line marks the boundary between the start arm and the maze choice point. Different panels represent wavelet transformations carried out using different parameters to optimize wavelet time-frequency resolution. (C) Unit activity in both structures is coordinated by hippocampal theta rhythm. A significant portion of units in both mPFC (20.2%) and CA1 (75.8%) showed greater than chance modulation of spiking activity by theta phase. Top: the magnitude of theta locking expressed in terms of the resultant vector length (see methods). Bottom: the proportion of CA1 and mPFC units passing significance at various alpha values. The dotted line represents alpha = 0.05. (D) mPFC and CA1 units fired at different preferred theta phases. Most CA1 units tended to fire near the trough of the hippocampal theta cycle, while mPFC units tended to prefer to fire early in the descending phase (Beta2 in (Lansink et al., 2016)). The different phase preferences correspond to a temporal offset in spiking between the two structures of about 51 ms. (E) Theta trough-triggered averages of the firing rate of mPFC and CA1 units verified the phase modulation of firing rates in both regions and the temporal offset of activity between the two structures.

