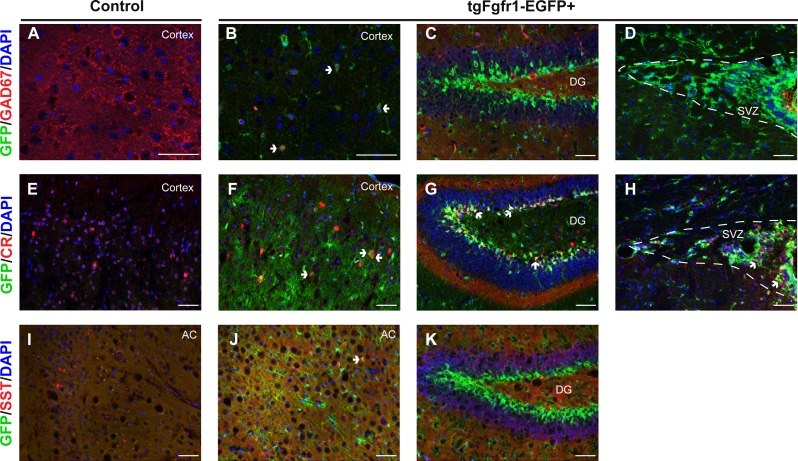
Figure 9. Fgfr1 expression in the 1-month interneurons.
GAD67, CR, SST, and GFP immunostaining of the cortex, DG, and SVZ in one-month old tgfgfr1-EGFP-controls (A, E, I, n = 2 SST, n = 3 GAD67, CR) and tgfgfr1-EGFP+ mice (B–D, F–H, J, K, n = 2 SST, n = 3 GAD67, CR). GFP+ cells colocalized with GAD67+ cells in the cortex (B, arrows), but not in the DG (C) and SVZ (D). Some CR+ cells express GFP in the cortex (F), DG (G) and SVZ (H). Some SST+ cells express GFP in the anterior cingulate of the cortex (J), but not in the DG (K). Scale bars are 50 µm. Dashed lines indicate SVZ, AC, anterior cingulate. Arrows denote double labeled cells.

