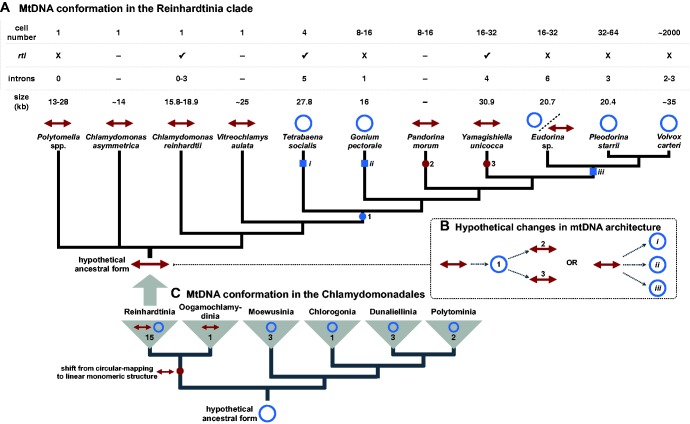
Fig. 1.—
Variation in mitochondrial genome structure across Reinhardtinia-clade (A) and chlamydomonadalean (C) algae. Blue circles and red arrowed lines represent circular-mapping and linear-mapping mtDNA conformations, respectively. Organismal and mitochondrial genome features are shown in the table above the tree in (A); rtl: reverse-transcriptase-like gene; dash (–): data not available. Squares and circles on the branches of the trees denote hypothetical shifts from linear to circular-mapping conformations (blue) and from circular-mapping to linear structures (red). Two hypothetical scenarios to explain the evolution of mtDNA conformation in Reinhardtinia algae (B); for others see supplementary figure S2, Supplementary Material online. Branching orders based on published phylogenetic analyses, including Nozaki et al. (2006), Nakada et al. (2008), Herron et al. (2009), and Lemieux et al. (2015), as well as the phylogenetic analysis shown in supplementary figure S3, Supplementary Material online. Note, some Polytomella and Oogamochlamydinia species can have linear-fragmented mtDNAs (Borza et al. 2009; Smith, Hua, et al. 2013).

