. 2017 Mar 31;35(1):71–77. doi: 10.3857/roj.2016.02005
Copyright © 2017 The Korean Society for Radiation Oncology
This is an Open Access article distributed under the terms of the Creative Commons Attribution Non-Commercial License (http://creativecommons.org/licenses/by-nc/4.0/) which permits unrestricted non-commercial use, distribution, and reproduction in any medium, provided the original work is properly cited.
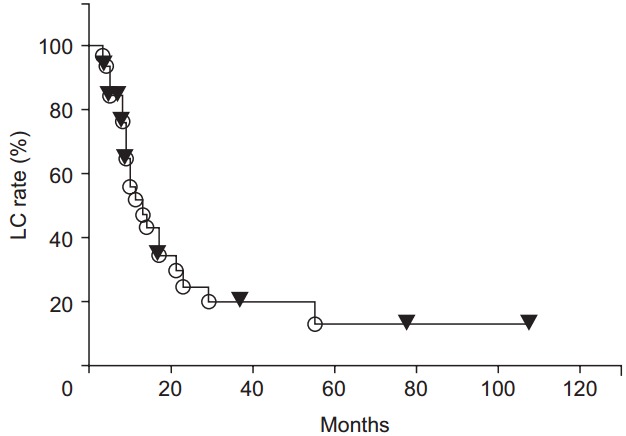
Fig. 1.

Local control (LC) rate curves after radiotherapy
