
Fig. 1.
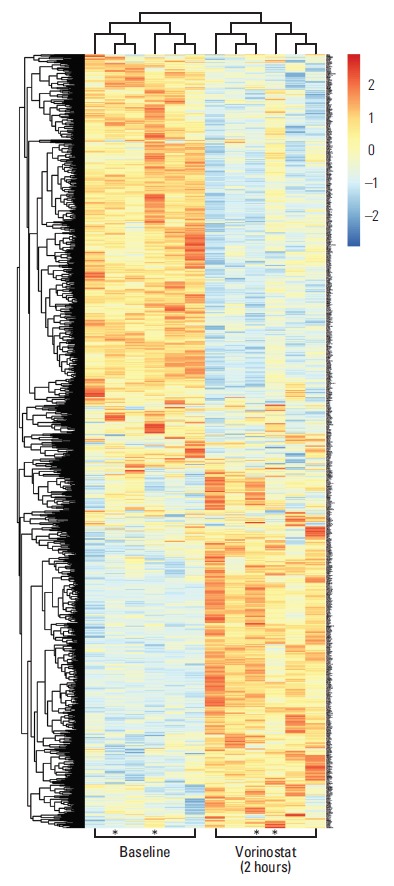
Heat-map presentation of differentially expressed transcripts in peripheral blood mononuclear cells sampled at baseline (before commencement of study treatment) and 2 hours after administration of vorinostat (400 mg), with colours representing high (red) to low (blue) levels of log2-transformed data and asterisks indicating the two patients who experienced intestinal dose-limiting toxicities.