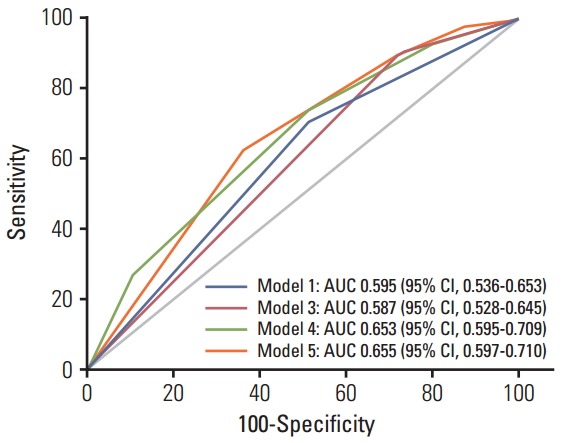
Fig. 2.

Receiver operating characteristic curve curves for prediction of grade ≥ 2 radiation-induced fibrosis based on different combinations of DNMT1 rs2228611 and/or mitochondrial haplogroup H, as described in Table 3. Model 5 vs. model 1, p=0.053; model 5 vs. model 3, p=0.009; model 5 vs. model 4, p=0.93. Model 2 is not shown since it is equivalent to model 3. AUC, area under the receiver operating characteristic curves; CI, confidence interval.
