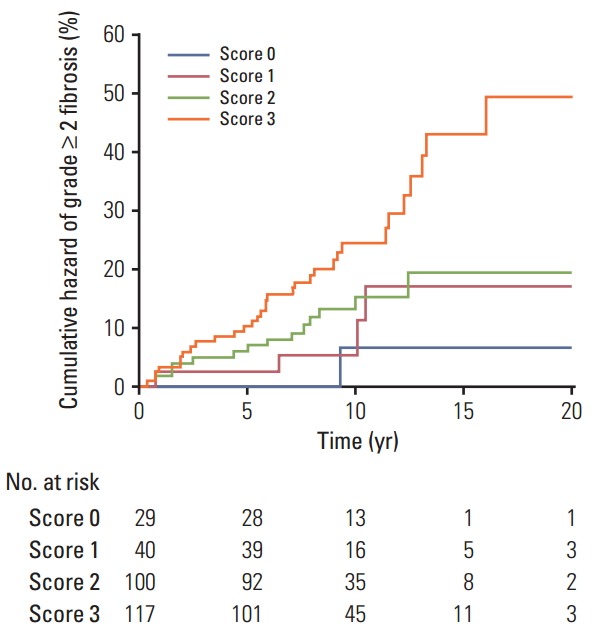
Fig. 3.

Kaplan-Meier plot of cumulative grade ≥ 2 radiation-induced fibrosis in breast cancer patients by sum risk scores based on model 5, which combines mitochondrial haplogroup H with the recessive contrast of DNMT1 rs2228611 (p trend=0.0005, log-rank test).
