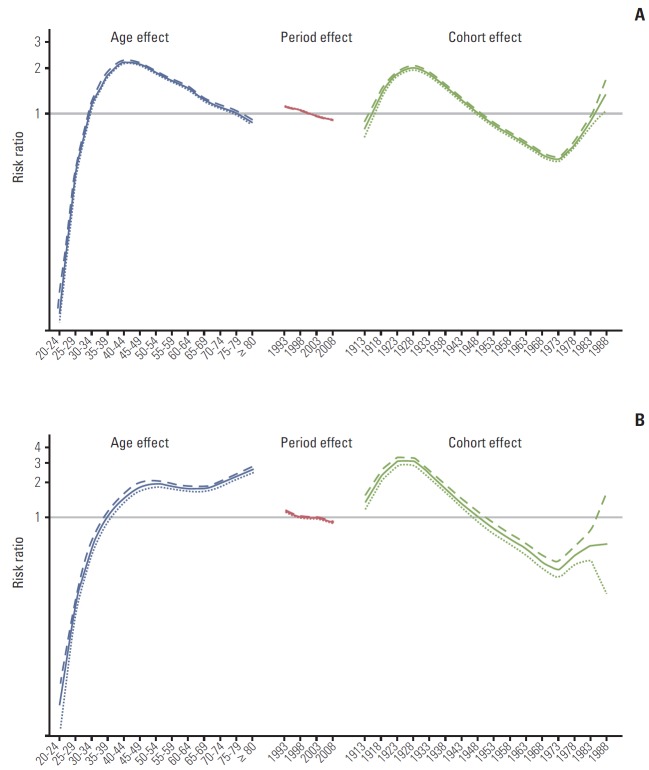
Fig. 3.
Age-period-cohort analysis of cervical cancer. (A) The incidences of cervical cancer in Korea. The blue line indicates the age effect and 95% confidence interval, the red line indicates the period effect and 95% confidence interval, and the green line indicates the cohort effect and corresponding 95% confidence interval. (B) The mortality rates for cervical cancer in Korea. The blue line indicates the age effect and 95% confidence interval, the red line indicates the period effect and 95% confidence interval, and the green line indicates the cohort effect and corresponding 95% confidence interval.

