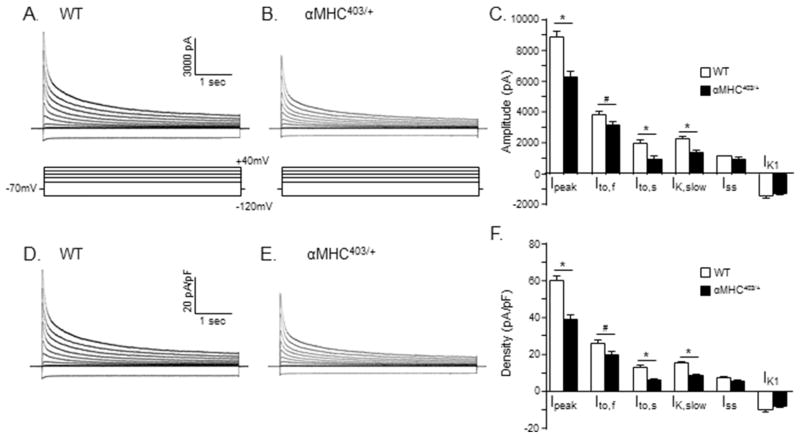
Figure 4. Repolarizing K+ current amplitudes/densities are significantly lower in myocytes isolated from the interventricular septum of young (10–12 week) male αMHC403/+, compared with WT, mice.
Representative whole-cell K+ current waveforms, recorded from isolated WT (A) and αMHC403/+ (B) interventricular septum myocytes in response to (4.5 s) voltage steps to test potentials between −120 and +40 mV from a holding potential (HP) of −70 mV, as described in Methods, are shown; the protocol is illustrated below the current records. Peak outward K+ currents were measured in each cell as the maximal outward current at +40 mV, and IK1 amplitudes in each cell were measured as the maximal inward current measured at −120 mV. The amplitudes of the individual Kv current components, Ito,f, Ito,s, IK,slow and Iss, were determined from exponential fits to the decay phases of the total outward currents evoked at +40 mV. (C) Mean ± SEM IK,peak, Ito,f, Ito,s, IK,slow, Iss and IK1 amplitudes in WT (n = 19; N = 4) and αMHC403/+ (n = 11; N = 3) interventricular septum myocytes are plotted. The amplitudes of each of the currents in each cell were normalized to the whole-cell membrane capacitance (measured in the same cell) to provide current densities. Normalized current densities for the representative WT and αMHC403/+ interventricular myocyte currents shown in (A) and (B) are presented in (D) and (E), respectively. Mean ± SEM IK,peak, Ito,f, Ito,s, IK,slow, Iss and IK1 densities in WT (n = 19; N = 4) and αMHC403/+ (n = 11; N = 3) myocytes are presented in (F). *,# Values in WT and αMHC403/+ are significantly different in αMHC403/+, compared with WT, interventricular septum cells at the *P<0.001 and #P<0.05 levels.

