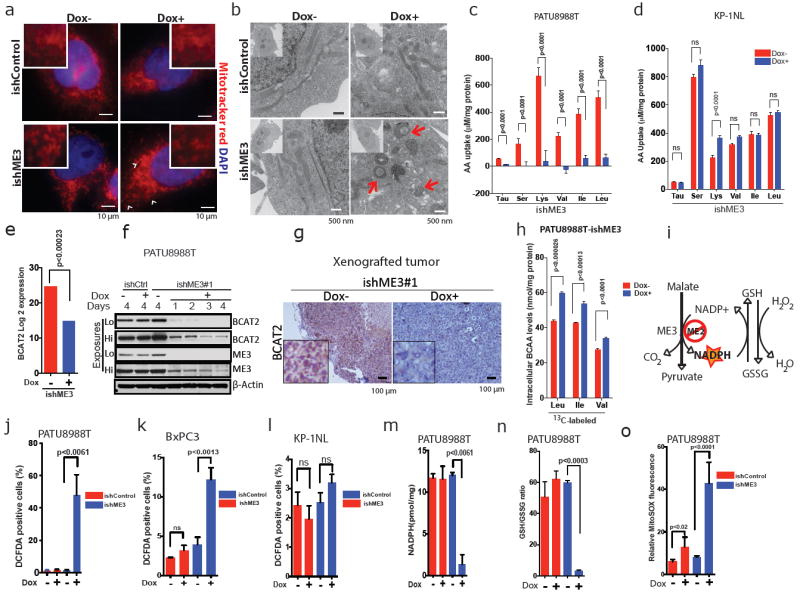
Figure 3. ME3 depletion in ME2-null PDAC cells leads to mitochondrial defects.

a, MitoTracker red staining in PATU8988T cells (arrow-head shows mitochondrial fission). Scale bar = 10 μm. b, TEM showing aberrant ring-shaped mitochondria (arrows in bottom right). Scale bar = 500 nm. c, d, Measurement of BCAA uptake in PATU8988T (c) and KP-1NL cells (d) (n = 6 each). Error bars represent the s.e.m.e, Log2 expression data of BCAA transaminase 2 (BCAT2) from RNA-seq data. f, Immunoblot of BCAT2 expression time course upon depletion of ME3. β-Actin used as loading control. g, Representative IHC images of BCAT2 in xenograft tumours. Scale bar = 100 μm. h, Plot of intracellular levels of BCAAs in ME3-depleted PATU8988T cells (n = 4). Error bars represent the s.e.m. i, Overview of malic enzyme reaction. J–l, Measurement of total ROS (as 2′,7′-dichlorofluorescin diacetate (DCFDA)-positive cells) in PATU8988T (j), BxPC3 (k) and KP-1NL (l) cells (n = 5 each). m, Measurement of NADPH in PATU8988T cells. n, Measurement of GSH/GSSG ratio in PATU8988T cells. o, Measurement of mitochondria-specific ROS (mitoSOX red) in PATU8988T cells. All error bars represent the s.d. except wherever mentioned otherwise. of at least three replicates from two independent experiments. P values were determined by two-tailed t-test.
