
Extended Data Fig. 1. ME2 is codeleted with SMAD4 in pancreatic cancer.
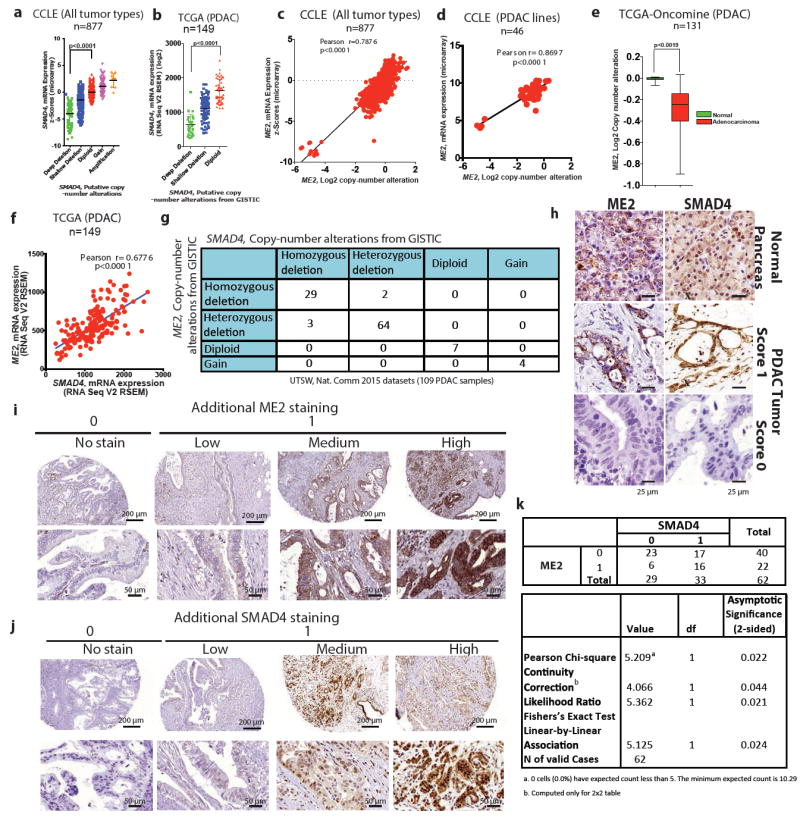
a, b, Scatterplots of SMAD4 mRNA expression against log2 CNA of all tumour types from CCLE datasets (a; n = 877), and PDAC samples in TCGA (b; n = 149). c, d, Scatterplots of ME2 mRNA expression against log2 CNA of all tumour types from CCLE datasets (c; n = 877) and PDAC samples from CCLE datasets (d; n = 46). e, log2 CNA of ME2 in TCGA PDAC database analysed by Oncomine (n = 131). f, Correlation between mRNA expression of ME2 and SMAD4 in TCGA PDAC database (n = 149). g, CNA of ME2 and SMAD4 in UTSW microdissected PDAC samples (Nature Communication data sets, 2015)7(n = 109) as reported by cBioportal were current in August 2016. h, Representative IHC images of SMAD4 and ME2 expression in PDAC samples compared with a matching normal pancreas sample. i,j, Additional ME2 (i) and SMAD4 (j) IHC images of PDAC samples. Staining is shown as no stain (score 0) and low-to-high staining (score 1). k, IHC analysis of paired normal and PDAC samples (n = 62) for ME2 and SMAD4 expression. Scoring is based on no expression (score 0) and low-to-high expression (score 1).