
Extended Data Figure 2. ME1 and ME3 are paralogous isoformsof ME2.
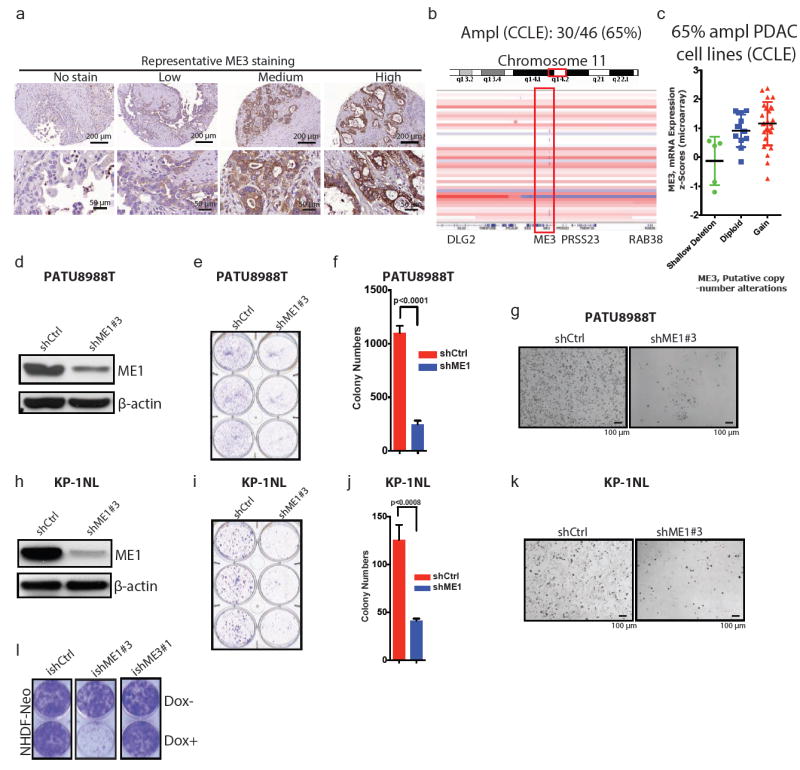
a, Representative IHC images of ME3 in PDAC samples. Staining is shown as no stain or low-to-high staining. b, IGV image of chromosome 11 encompassing region q14 of PDAC cell lines from CCLE (n = 46). c, ME3 mRNA expression against log2 copy number of PDAC lines from CCLE (n = 46). d, Expression of ME1 upon depletion of ME1 in PATU8988T cells. β-Actin used as loading control. e, Colony-formation assay of cell lines corresponding to the immunoblot in d. f, Quantification of the colony-formation assay in e. g, Representative microscopic fields of PATU8988T shCtrl and shME1#3 cells (Scale bar= 100 μm). h, Expression of ME1 upon depletion of ME1 in KP-1NL cells. i, Colony-formation assay corresponding to the immunoblot in h. j, Quantification of the colony-formation assay in i. k, Representative microscopic fields of KP-1NL shCtrl and shME1#3 cells (Scale bar= 100 μm). l, Colony-formation assay of NHDF-Neo cells (skin fibroblast cell line) (ishCtrl ± dox, ishME1#3 ± dox and NHDF-Neo/ishME3#1 ± dox). β-Actin used as loading control. Error bars represent s.d. of at least n = 3 replicates.