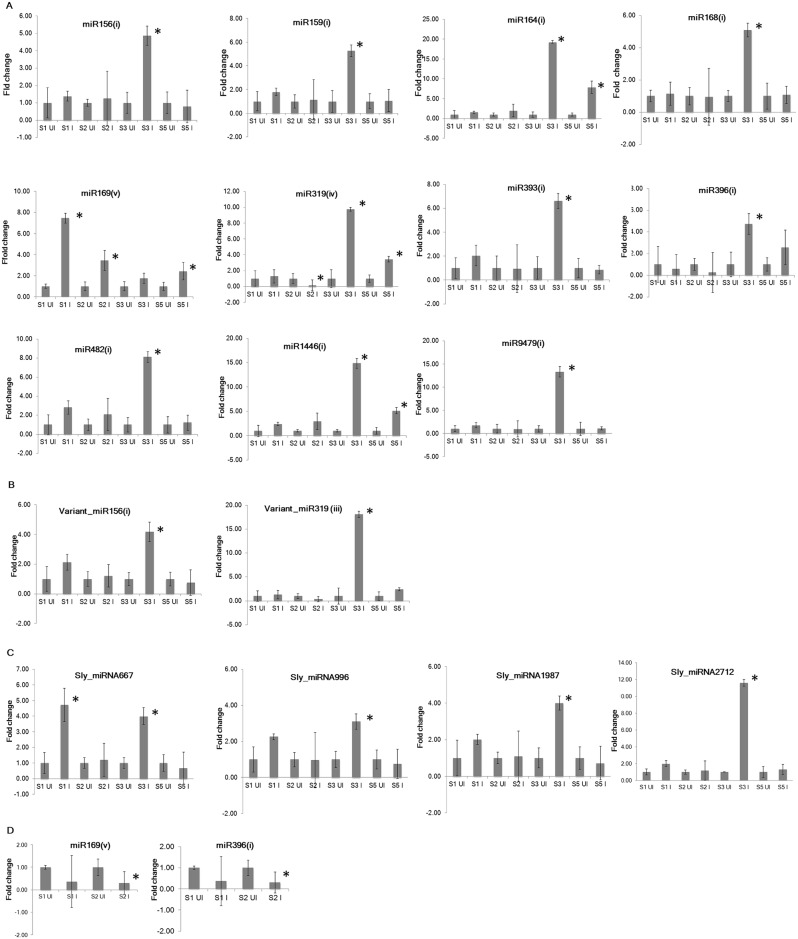
Fig 3. Expression analysis of tomato miRNAs through qRT-PCR at four stages of disease development during susceptible response (A-C) and at two stages of disease development during resistance response (D).
To normalize the expression level, 18S rRNA was selected as internal control. All the experiments were conducted using two technical replicates for each of three biological replicates. Fold change was calculated through delta delta Ct method that represents the change in expression level in the infected sample relative to uninfected control sample. Data is the average of three biological replicates ± standard error of the mean. The student’s t-test (P < 0.05) was performed to determine significant difference in miRNA expression between uninfected and infected sample. The significant difference (P < 0.05) obtained for an infected stage is marked with * in the figure. S1-Stage 1, S2-Stage 2, S3-Stage 3, S5-Stage 5, UI-Uninfected sample, I-Infected sample.

