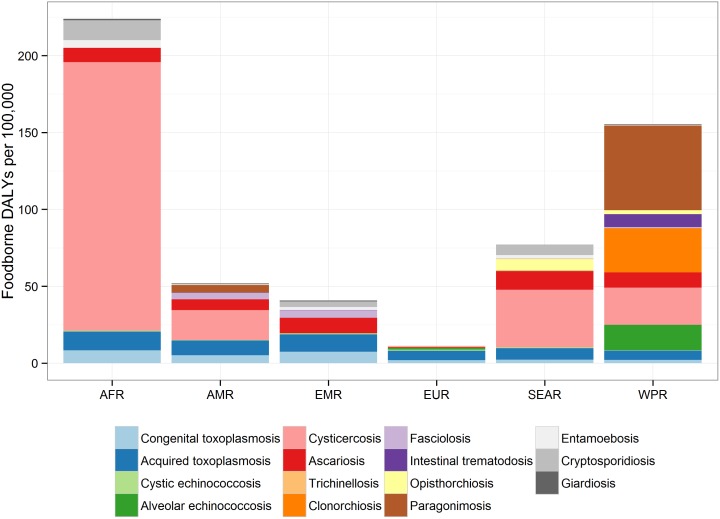
Fig 1. Contribution of each parasite to foodborne disability adjusted life years in regions: The relative contribution to the DALY incidence by each agent for each of the regions.
This includes enteric protozoa to complete the picture on foodborne parasitic diseases. The figure, title and legend were taken from Figure 4 in [2] (http://dx.doi.org/10.1371/journal.pmed.1001920.g002). No changes were made to the original figure, title and legend in [2].

